Amazon.com is not cheap. The stock is up 83% from its 2022 crisis low of $81.43, and at $175 it trades at a trailing P/E north of 60×. Every analyst consensus screen will tell you that. What those screens will not tell you is what has changed inside the company - and why the current multiple may be less expensive than it appears.
In the fourth quarter of 2023, Amazon generated $169.96 billion in revenue - beating consensus by $3.7 billion - and $13.2 billion in operating income, more than doubling the year-ago quarter. AWS margins have climbed from a trough of 24.0% in Q1 2023 back to 29.6% in Q4, signaling that the post-pandemic cloud optimization cycle is ending. Retail - the segment that nearly everyone has dismissed as a structural margin sink - delivered positive operating income for the first time since the pandemic hiring spree. And advertising, quietly, grew to a $46.9 billion annualized run-rate, making Amazon one of the largest ad platforms on the planet.
The market has priced in the recovery from 2022. It has not priced in the operating leverage that comes next. At 18.7× adjusted operating cash flow and 20.7× EV/EBITDA - both below their five-year averages - the entry zone of $170–$180 is a position on margin expansion, not a bet on top-line surprise. The entry zone is the price you pay for that operating leverage.
Market Research Team, PolyMarkets Investment Strategies
Amazon at a Glance
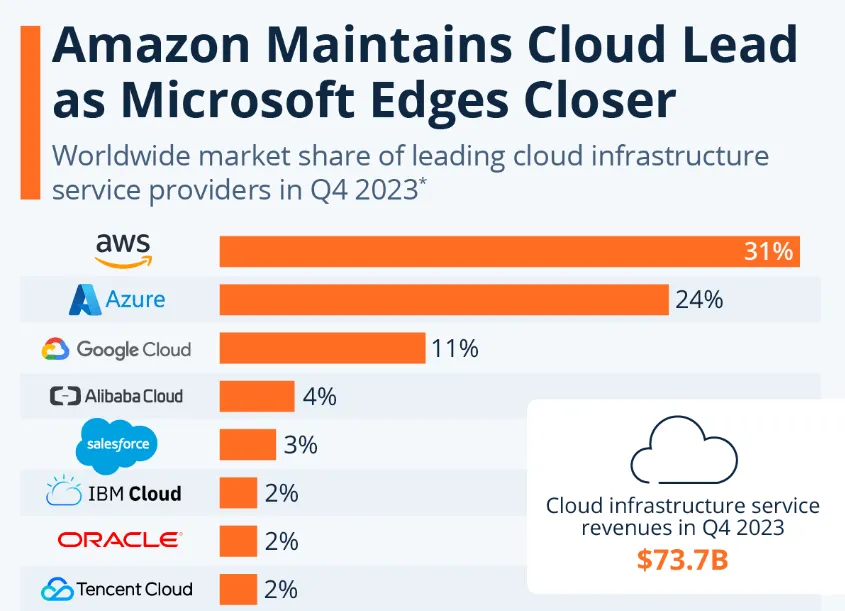
Amazon.com, Inc. is a $1.82 trillion company that operates across three business segments that are each, individually, among the largest enterprises on earth. AWS is the world's leading cloud infrastructure provider with 31% global market share. Amazon's e-commerce platform controls 37.6% of US online retail - more than the next six competitors combined. And its advertising business, largely invisible a few years ago, has grown to rival YouTube in annual revenue. Understanding Amazon requires understanding that these are not separate businesses bolted together. They are a self-reinforcing system where scale in one segment generates cost advantages in the others.
At the time of writing, Amazon trades at $175.35 per share. The stock has recovered strongly from the 2022 bear market that took it from $188 to $81 - a 57% drawdown driven by an over-hired, over-invested post-pandemic hangover. But the company that exists in March 2024 is operationally very different from the one that entered the crisis. Headcount has been reduced by over 27,000. Fulfillment network efficiency has been completely restructured into regional hubs. AWS cost optimization headwinds are fading. And for the first time in years, the operating income trajectory is genuinely accelerating.
The 2022 Crisis & What Changed
To understand why Amazon at $175 is potentially attractive despite being up 83% from the bottom, you need to understand what went wrong - and, more importantly, what has been fixed.
The story begins in the pandemic. Between 2020 and 2021, Amazon hired approximately 750,000 new employees - effectively doubling its workforce - and invested roughly $120 billion in capital expenditure to build out logistics capacity for what it expected would be a permanently elevated e-commerce growth rate. That assumption proved wrong. As the world reopened, e-commerce growth normalized sharply. Amazon was left with too many warehouses, too many workers, and a cost structure designed for 30% revenue growth that was now growing at 9%.
The result was Amazon's worst year of profitability since the early AWS era. Full-year 2022 operating income fell to $12.2 billion - down from $24.9 billion in 2021 - and the retail segment swung into negative territory with a -2.4% EBIT margin. The stock market, correctly, punished the company. Amazon fell 57% from its July 2021 peak to its January 2023 trough.
"We got too big, too fast, during the pandemic. That's behind us. The efficiency work, the regionalization of the fulfillment network - you're seeing the early benefits and there's more to come."
- Andy Jassy, CEO, Amazon Q4 2023 Earnings CallWhat happened next is the part the market has not fully rewarded. Under CEO Andy Jassy, Amazon executed one of the most aggressive operational restructurings in big-tech history. The company reduced headcount by 27,000+. It redesigned its US fulfillment network from a national model to eight interconnected regional hubs - cutting delivery distances, reducing cost-per-package, and improving speed simultaneously. The cost-of-sales ratio for the retail segment fell from 67% of revenue in 2022 to approximately 53% in 2023. Operating expenses as a percentage of sales dropped from 56.2% to 53.0%.
The financial impact was immediate and dramatic. Full-year 2023 revenue grew 12% to $574.9 billion. Operating income nearly tripled to $36.9 billion. Net income swung from a loss of -$2.7 billion in 2022 to a profit of $30.4 billion. Operating cash flow reached $84.9 billion - up 82% year-over-year. Adjusted operating cash flow hit $96.5 billion. This was not a one-quarter anomaly. It was a systematic margin recovery driven by structural changes that are still in their early innings.
Three Pillars: AWS, Retail, Advertising
Amazon's value proposition becomes clearer when you stop thinking of it as one company and start thinking of it as three businesses at different stages of their margin cycle - each reinforcing the others. The three-pillar framework is not decorative. It is the reason Amazon's operating leverage is higher than most investors realize.
31% global cloud market share. Margins bottomed at 24.0% in Q1 2023 as enterprises optimized spending, now recovered to 29.6%. Customer optimization cycles are ending - reacceleration in new workloads beginning. Claude 3 (Anthropic) integration positions AWS at the center of the AI infrastructure buildout.
37.6% US e-commerce share - 6× Walmart's online share. Regional fulfillment redesign cutting cost-per-package. 3P seller services (28.9% of retail revenue) growing at 2× the rate of 1P. EBIT margin turned positive for the first time since 2021 - from -2.4% in 2022 to +2.5% in 2023.
Amazon's fastest-growing high-margin segment. Grew 24% YoY in Q4 2023. Advertisers pay to rank on Amazon's marketplace - a business with near-zero incremental cost. Estimated to generate $30B+ in operating profit by 2025. Prime Video ads launch in Q1 2024 - a new, largely untapped inventory source.
The key insight is the margin composition. AWS contributes roughly 16% of revenue but historically 60–70% of operating income. Advertising contributes roughly 8% of revenue but - at estimated 70–80% gross margins - is rapidly becoming the second-largest profit contributor. Retail is the revenue engine with the lowest margins, but those margins are improving at the fastest rate. The weighted effect is a company whose blended operating margin is expanding even if top-line growth moderates. That is operating leverage - and it is what the current valuation multiples do not fully capture.
The Financial Inflection
The most compelling evidence for the Amazon thesis is not in analyst models. It is in the company's own cash flow statement - specifically, the transformation between FY2022 and FY2023.
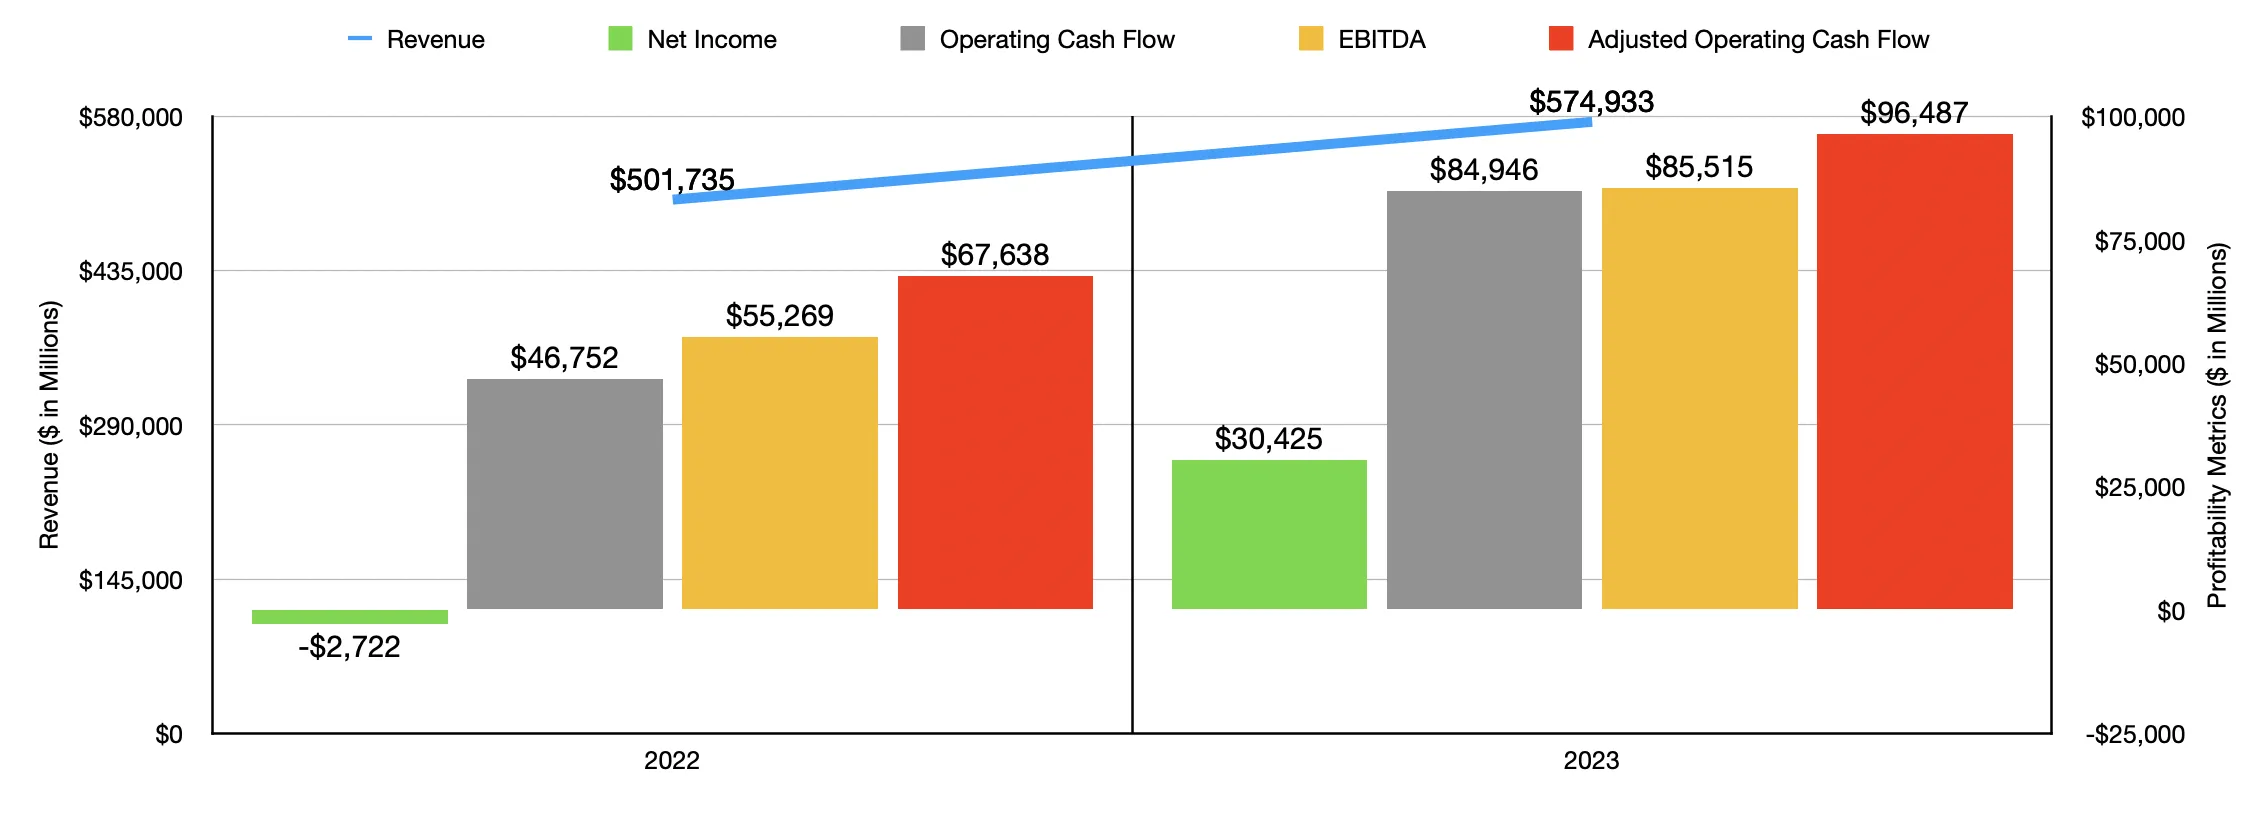
The numbers above tell the inflection story in one image. Revenue grew 12% - solid, but not explosive. What changed was everything below the top line. Net income swung from negative $2.7 billion to positive $30.4 billion - a $33 billion improvement driven almost entirely by operational efficiency, not revenue growth. Operating cash flow rose 82% to $84.9 billion. Adjusted operating cash flow - which adds back principal repayments on finance leases - reached $96.5 billion. EBITDA expanded from $55.3 billion to $85.5 billion.
The balance sheet is equally striking. An analyst examining Amazon's net debt position found that the widely cited $74.8 billion in "net debt" (per S&P Capital IQ) was misleading - it included $75.6 billion in operating lease liabilities. Strip those out, and Amazon had a net cash position of approximately $845 million at the end of 2023 - effectively debt-neutral. Add the $28.5 billion in cash and marketable securities sitting on the balance sheet, and the picture is of a company with enormous financial flexibility at the exact moment it needs to invest in AI infrastructure.
AWS Margin Recovery - The Profit Pendulum
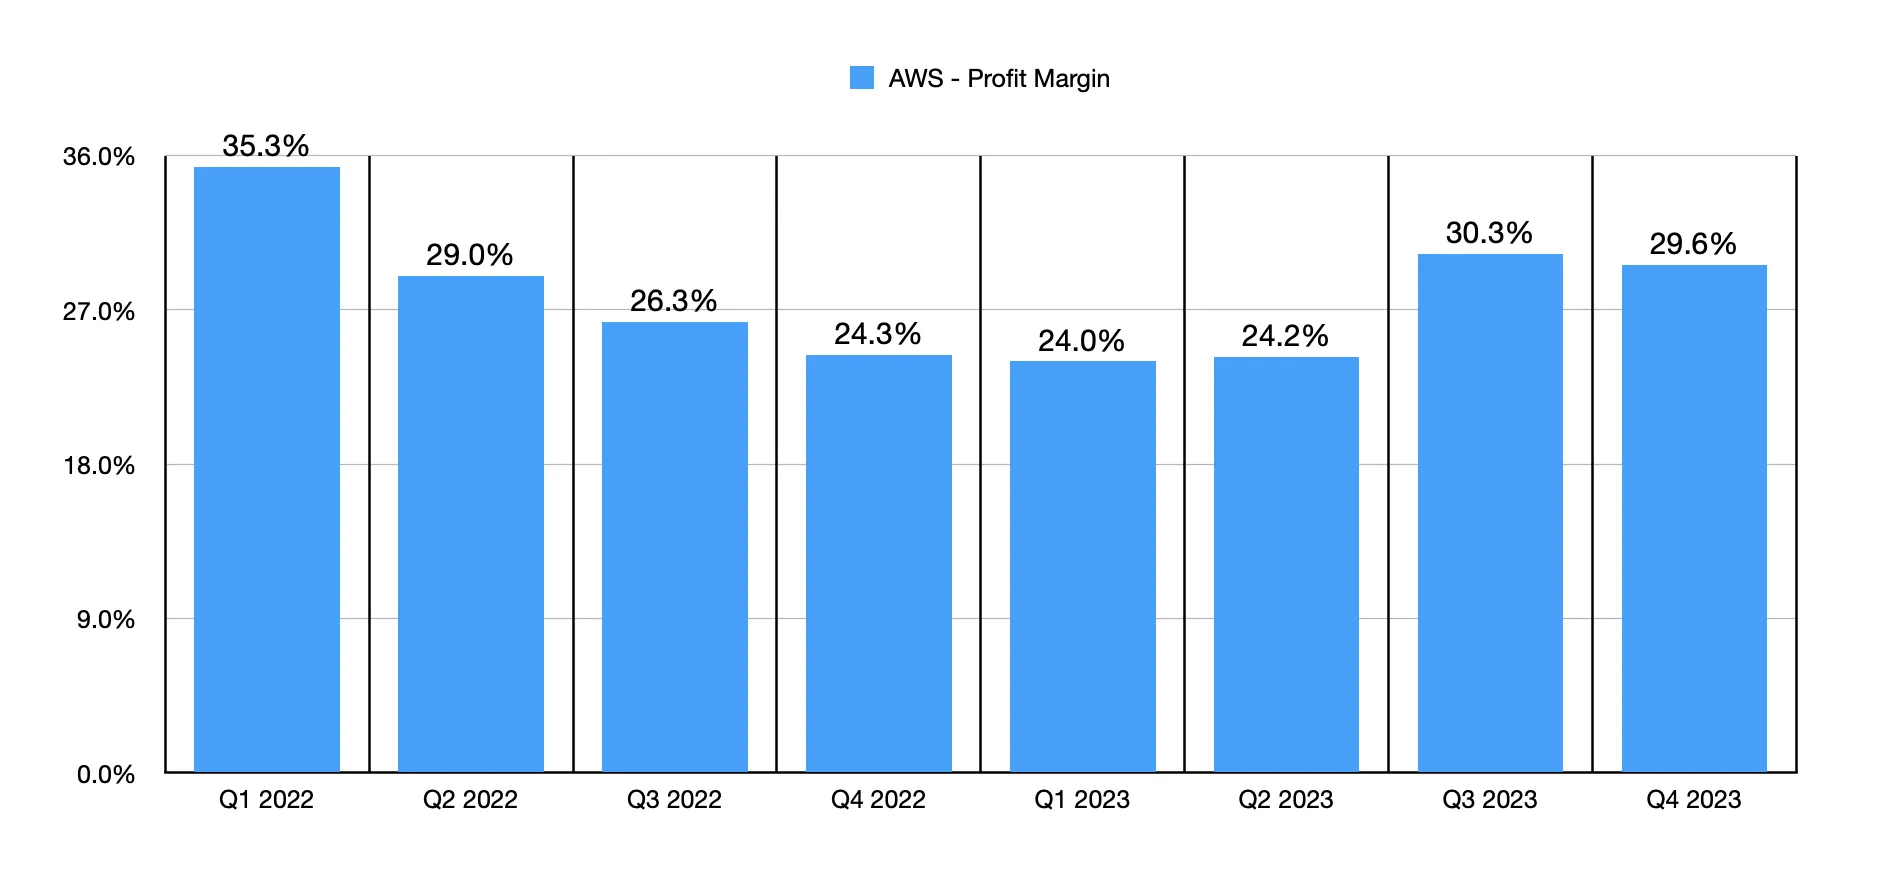
The chart above tells the AWS margin story quarter by quarter. After peaking at 35.3% in Q1 2022, margins fell to 24.0% by Q1 2023 as enterprise customers aggressively optimized their cloud spending - extending reserved instances, shutting down unused workloads, renegotiating contracts. This was the "cloud optimization cycle" that hit all three hyperscalers. But the trough is now clearly behind us. Q3 2023 hit 30.3%, Q4 came in at 29.6%. As optimization headwinds fade and new generative AI workloads begin to scale, the forward margin trajectory looks favorable.
Valuation Multiples - Below the Five-Year Average
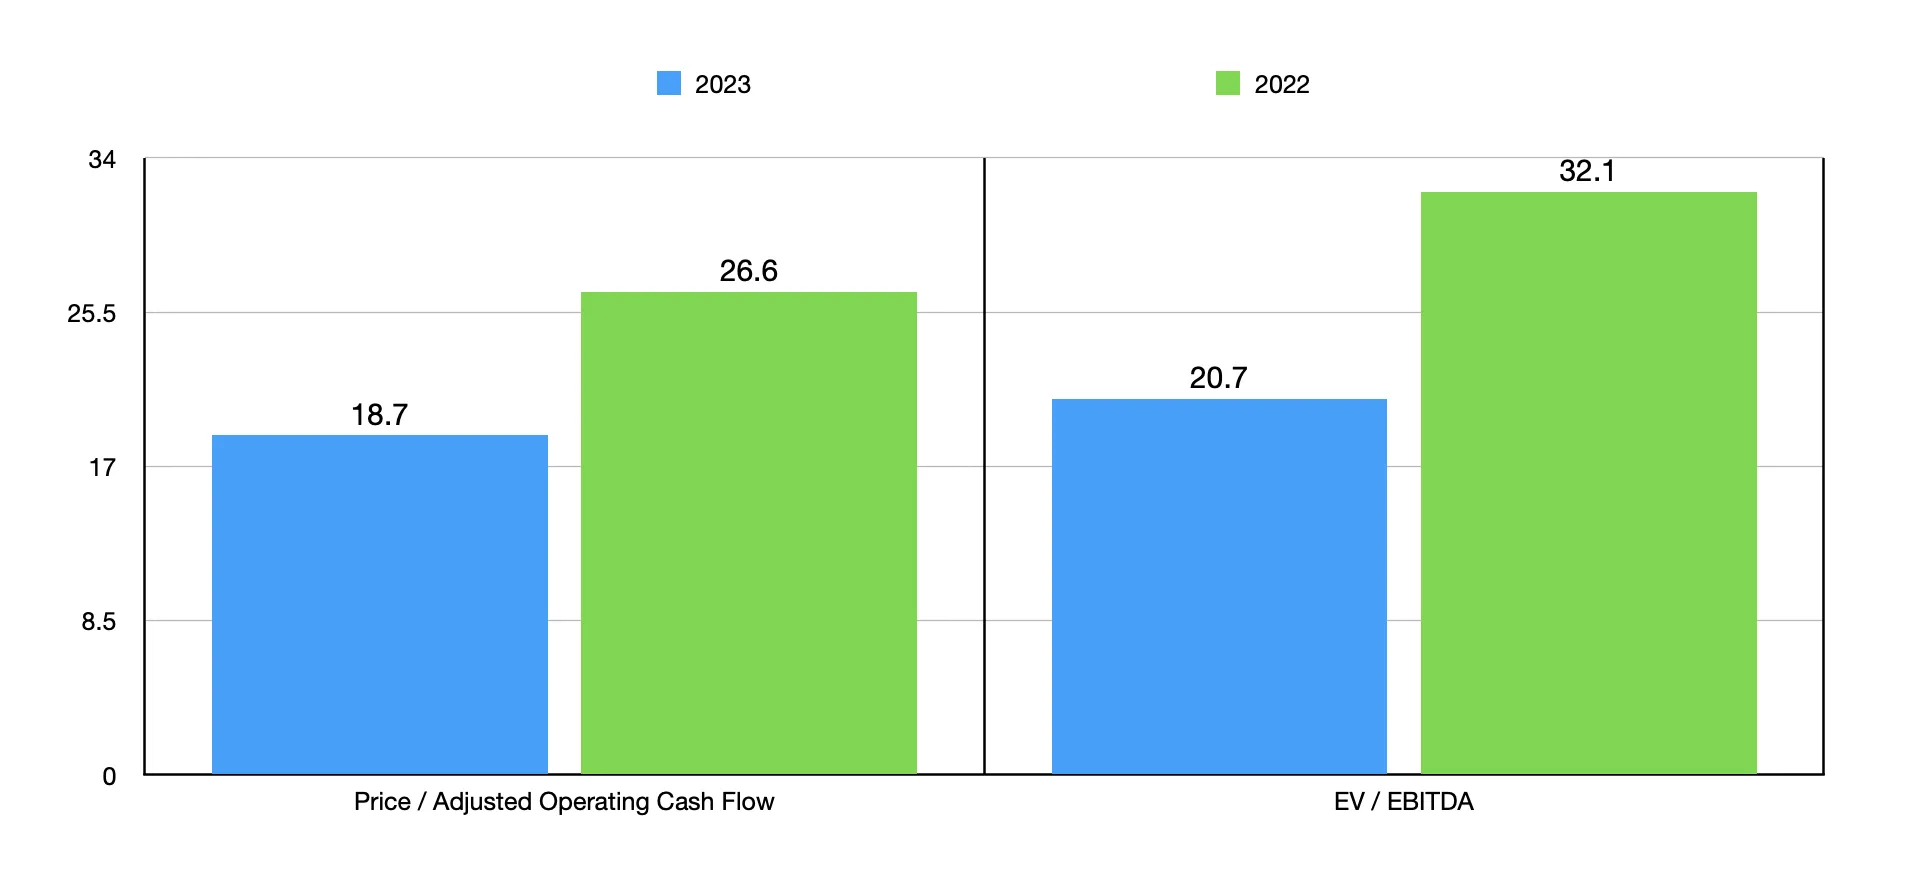
Despite the 83% rally from the bottom, Amazon's valuation multiples have actually compressed. Price-to-adjusted-operating-cash-flow has fallen from 26.6× in 2022 to 18.7× in 2023 - because cash flow grew faster than the stock price. EV/EBITDA dropped from 32.1× to 20.7×. Both metrics are now below their five-year averages. The market has rewarded the recovery but has not yet fully priced in the next leg of margin expansion. That is the opportunity.
The AI Catalyst - Claude, NVIDIA, and the Next Cloud Wave
If the margin recovery story is the base case for Amazon, the AI infrastructure buildout is the upside case - and it is arriving faster than most models anticipated.
AWS's 31% market share gives it the largest installed base of cloud customers in the world. When enterprises begin deploying generative AI workloads at scale - fine-tuning foundation models, running inference endpoints, building AI-native applications - the default deployment target for most will be whichever cloud provider they already use. Switching costs in cloud infrastructure are enormous: migrating data, rewriting integrations, retraining operations teams. AWS's existing customer relationships are, in practice, a distribution moat for AI.
Amazon has made this position explicit through its partnership with Anthropic. The company invested up to $4 billion in the AI startup behind the Claude family of models - and in March 2024, Anthropic launched Claude 3 (Opus, Sonnet, and Haiku variants) exclusively through AWS Bedrock alongside direct API access. Benchmark results show Claude 3 Opus outperforming GPT-4 on several key metrics, including undergraduate-level knowledge (86.8% vs. 86.4%) and multilingual math reasoning. By integrating Claude natively into Bedrock, AWS offers enterprise customers access to frontier AI models without leaving the AWS ecosystem.
"Generative AI is probably the largest technology transformation since the cloud itself - maybe since the internet. And AWS is at the center of it."
- Andy Jassy, CEO, Amazon Q4 2023 Earnings CallSimultaneously, Amazon has expanded its partnership with NVIDIA, integrating next-generation GPU clusters into AWS data centers while also developing its own custom silicon - the Trainium and Inferentia chips - which offer a lower-cost alternative for training and inference at scale. This dual strategy - NVIDIA for maximum performance, custom silicon for cost-optimized workloads - gives AWS pricing flexibility that competitors relying solely on NVIDIA cannot match.
The financial implication is significant. AI workloads are compute-intensive and high-margin. As generative AI moves from experimentation to production deployment over 2024–2025, AWS revenue growth should reaccelerate from the 13% YoY rate in Q4 2023 toward the high-teens or low-20s. Because these are new workloads layered onto existing infrastructure - with much of the cost already depreciated - the incremental margins on AI revenue are likely higher than AWS's already-strong 27–30% operating margin.
Valuation: Cheaper Than It Looks
Amazon's headline P/E ratio - currently above 60× trailing earnings - is the single most misleading number in its financial profile. It reflects 2023 net income that was depressed by prior-year write-downs, Rivian investment losses, and restructuring charges. The metric that institutional investors actually use to value Amazon is the price-to-adjusted-operating-cash-flow multiple, and on that basis, the stock is notably inexpensive.
| Metric | Current (2023) | 5-Year Average | Premium / Discount |
|---|---|---|---|
| P / Adj. Operating Cash Flow | 18.7× | ~26× | -28% discount |
| EV / EBITDA | 20.7× | ~28× | -26% discount |
| EV / Revenue | ~3.2× | ~3.5× | -9% discount |
| FCF Yield (Adj.) | ~5.3% | ~3.5% | +51% premium |
A DCF analysis using 10% top-line growth - roughly in line with consensus - projects cumulative free cash flow of approximately $510 billion over the next decade, with a terminal value of $2.14 trillion. That produces a total enterprise value of $2.57 trillion, implying 38% upside from the current $1.86 trillion market cap. Even a more conservative 9% growth assumption yields $1.97 trillion - still suggesting the stock is approximately fairly valued at current levels, with no margin expansion baked in.
Goldman Sachs' base case DCF arrives at $220. Argus Research targets the low $210s. The consensus Wall Street price target sits at approximately $210–$220 - representing 20–26% upside from the $175 entry zone. None of these models aggressively price in the AI revenue tailwind or advertising margin expansion. They are largely mechanical extrapolations of current trends. If margins expand faster than modeled - which the data so far suggests is happening - the fair value moves materially higher.
The Debate - What Bears Get Right and Wrong
The honest assessment of any investment requires engaging with the bear case on its own terms. Amazon has legitimate risks that deserve serious consideration. But the distinction between risks that are priced in and risks that are genuinely underappreciated matters enormously for expected returns.
Bear Case Arguments
- P/E still elevated above 60× trailing - "expensive" by traditional metrics
- AWS growth decelerated to 13% YoY in Q4 2023 - Azure growing faster
- Retail margins (2.5% EBIT) remain razor-thin - structural ceiling?
- AI capex will be enormous - could pressure FCF for years
- Antitrust scrutiny from FTC, EU Digital Markets Act compliance
- 3P seller dependence - 60% of units from third-party sellers
Bull Case Counterpoints
- P/E is misleading - P/Adj. OCF of 18.7× is 28% below 5-year average
- AWS deceleration was the optimization cycle - now clearly reflating (30.3% margin Q3)
- Retail margins went from -2.4% to +2.5% in one year - trajectory matters more than level
- AI capex flows through AWS revenue at 27%+ margins - investment, not cost
- Regulatory risk is priced in at a discount; no breakup scenario on the table
- 3P is a feature, not a bug - higher margin, wider selection, better economics
The core bear thesis - that Amazon is "expensive" - rests almost entirely on the trailing P/E, which is a deeply flawed lens for a company generating $96.5 billion in adjusted operating cash flow. The more sophisticated bear argument - that AWS is losing share to Azure - deserves scrutiny. Microsoft's Azure has grown faster in percentage terms, but from a smaller base. AWS added approximately $7 billion in net new revenue in 2023. The two platforms are not zero-sum; the total addressable market is expanding. As Andy Jassy noted on the earnings call, 90% of global IT spending is still on-premise. The cloud migration is a decade-long secular trend, not a share-stealing game.
Technical Picture
The technical picture for AMZN at $175 shows a stock in a well-established uptrend from the January 2023 low of $81.43, trading above its 50-day and 200-day moving averages. The stock recently consolidated in the $165–$180 range following a strong run from sub-$140 in October 2023 - a healthy base-building pattern rather than distribution.
While the price action described above illustrates the technical structure, the DCF model below provides the valuation anchor that gives this technical setup its fundamental conviction. A stock consolidating in a base above its moving averages is interesting; a stock doing so at a 38% discount to a conservative intrinsic value estimate is compelling.
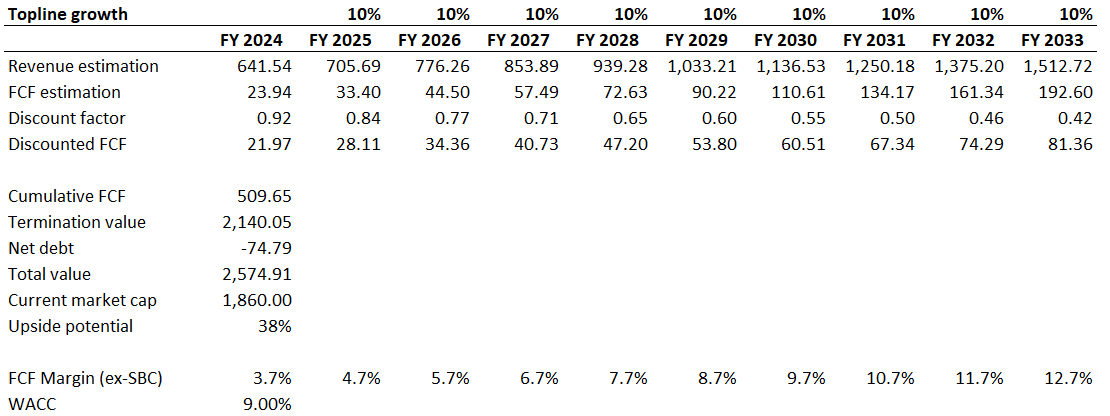
The DCF model above projects Amazon's free cash flow through FY2033 under a 10% annual revenue growth assumption - roughly in line with consensus. FCF margins are modeled expanding from 3.7% to 12.7% as the operating leverage story plays out. The resulting enterprise value of $2.57 trillion implies 38% upside from the current $1.86 trillion market cap. Importantly, this is a conservative model: it does not assume any re-rating of the multiple, and the 9% WACC is at the higher end of reasonable estimates. The sensitivity is instructive - even dropping growth to 9% annually produces a fair value of $1.97 trillion, suggesting the stock is approximately fairly valued at current levels before any AI-driven revenue acceleration. The base case is not a stretch. The upside case is what happens if margins expand faster than modeled.
The key technical levels to watch: $165 represents strong support (the recent consolidation floor and prior breakout level). $180 is the immediate resistance zone - a clean breakout above $180 on volume would signal the next leg higher toward the $200+ range. The 200-day moving average, rising through approximately $145, provides a structural floor for the broader uptrend. A weekly close below $145 would invalidate the bullish structure. The risk/reward from the $170–$180 entry zone is asymmetric: $25 of downside risk to the $145–$150 support zone versus $45–$65 of upside to the $220–$240 target range.
Scenario Analysis - Three Paths Forward
The three scenarios below model different combinations of revenue growth and margin expansion over the next 12–18 months. The base case is not a stretch - it largely extrapolates current trends. The bull case incorporates meaningful AI revenue acceleration.
- AWS growth stalls at 12–13% as Azure takes share
- Retail margins plateau at 2.5% - no further improvement
- AI capex rises without near-term revenue offset
- Macro slowdown dampens consumer spending
- Multiple compresses to 16–17× adj. OCF
- AWS reaccelerates to 15–17% growth on AI workloads
- Retail EBIT margin expands to 3.5–4.0%
- Advertising scales to $55–60B ARR
- Blended operating margin reaches 8–9%
- Multiple holds at 19–21× adj. OCF
- AWS inflects to 20%+ growth as AI reaches production scale
- Retail margins hit 5%+ - fulfillment efficiency + 3P mix shift
- Advertising becomes #2 profit center behind AWS
- Blended operating margin reaches 10%+
- Re-rating to 23–25× adj. OCF on growth reacceleration
The asymmetry is notable. Bear case downside of 6–14% from the entry zone versus base case upside of 26–34% and bull case upside of 37–49%. The risk/reward ratio works because the entry zone captures Amazon at a moment where the margin recovery is well-established but not yet fully priced, and the AI catalyst is just beginning to layer into the financials.
Risk Register
Medium AWS Competitive Pressure
Azure is gaining share in enterprise, and Google Cloud is closing the gap at 11%. If AWS growth decelerates to single digits, the premium multiple deflates. Mitigant: 90% of IT is still on-prem; the market is expanding, not just being split.
Medium AI Capex Intensity
Building AI infrastructure at scale requires billions in GPU clusters and data centers. Near-term FCF could be pressured. Mitigant: AI capex becomes AI revenue at 27%+ margins; Amazon has $28.5B in cash and $96.5B in adj. OCF to fund it.
High Regulatory / Antitrust
FTC lawsuit alleging monopolistic practices in marketplace. EU Digital Markets Act imposes new compliance requirements. Mitigant: No realistic breakup scenario; compliance costs manageable at Amazon's scale. Priced into current discount.
Low Consumer Spending Slowdown
Macro recession could dampen e-commerce growth. Mitigant: Amazon gains share in downturns as consumers seek value; 37.6% share could expand further. AWS (enterprise) and Ads (performance-driven) are more resilient to consumer cycles.
Medium Retail Margin Ceiling
2.5% EBIT margin on retail may be near a structural limit given Amazon's low-price strategy. Mitigant: 3P seller mix (higher margin), advertising embedded in retail (pure profit), and fulfillment efficiency gains still early.
Low Cybersecurity / Data Breach
A major AWS data breach could damage enterprise trust. Mitigant: AWS has the most mature security certification portfolio among hyperscalers; reputation risk is real but probability is low given investment levels.
Catalyst Timeline
The Trade
The thesis is operating leverage. Amazon's revenue engine is growing at 10–15%, but the operating income is growing at 40–50%+ because structural cost reductions and high-margin business mix shifts are compounding simultaneously. The $170–$180 entry zone captures this inflection at multiples below the five-year average.
Position Summary
Market Research Team, PolyMarkets Investment Strategies
Disclaimer
This analysis is published for educational and informational purposes only and does not constitute financial advice, an investment recommendation, or a solicitation to buy or sell any security. The content reflects the author's analytical framework as of the publication date and may not reflect current market conditions. All investing involves risk, including the possible loss of principal. Past performance is not indicative of future results. Readers should conduct their own due diligence and consult with a qualified financial advisor before making any investment decisions. The authors and PolyMarkets Investment Strategies may hold positions in securities discussed herein.