There is something almost perverse about what has happened to Dell's stock in recent months. The company just delivered its strongest fiscal year in history - $95.6 billion in revenue, 8% growth, non-GAAP EPS of $8.14 rising 10% year-over-year, a record $10 billion in AI server shipments, and a $9 billion AI order backlog that keeps expanding every single quarter. It returned $3.9 billion to shareholders via buybacks and dividends, raised that dividend by 18%, and authorised a fresh $10 billion in buybacks. And yet the stock, as of this writing, sits around the $80–$87 range - a 9× forward earnings multiple - while the broader market has spent the better part of the past year repricing AI exposure at premium multiples.
I have been watching this name for months, and the disconnect has grown to a point where I find it genuinely difficult to construct a bearish case that justifies the current discount. This is not a speculative AI trade. This is a hardware infrastructure company with a growing backlog, expanding margins, and two distinct growth drivers working simultaneously. The Infrastructure Solutions Group - servers, networking, storage - is operating at record margins and growing at 22% year-over-year. The Client Solutions Group - PCs, workstations, peripherals - is quiet right now but sits in front of one of the most predictable upgrade supercycles the industry has seen in years: the Windows 11 migration, with the Windows 10 end-of-life deadline in October 2025 acting as a hard forcing function.
The market is pricing Dell as though one of these two engines doesn't exist. I think both work. I think the re-rating from a discount industrial to a rightfully valued AI infrastructure and PC platform company could produce returns of 50–65% in 9–12 months. The entry zone of $80–$87 provides a margin of safety that I find rare at this stage of the technology cycle. This is the case.
(+8% YoY)
(+10% YoY, Record)
(+22% YoY)
(Q4, +480bps QoQ)
(Growing Every Qtr)
Shipment Guidance
Market Share (IDC)
(vs. Peer Premium)
Two Engines. One Discount.
The simplest version of the Dell thesis is this: the market is applying one multiple to a company that runs two separate and independent return drivers - and doing so at a time when both drivers are simultaneously improving.
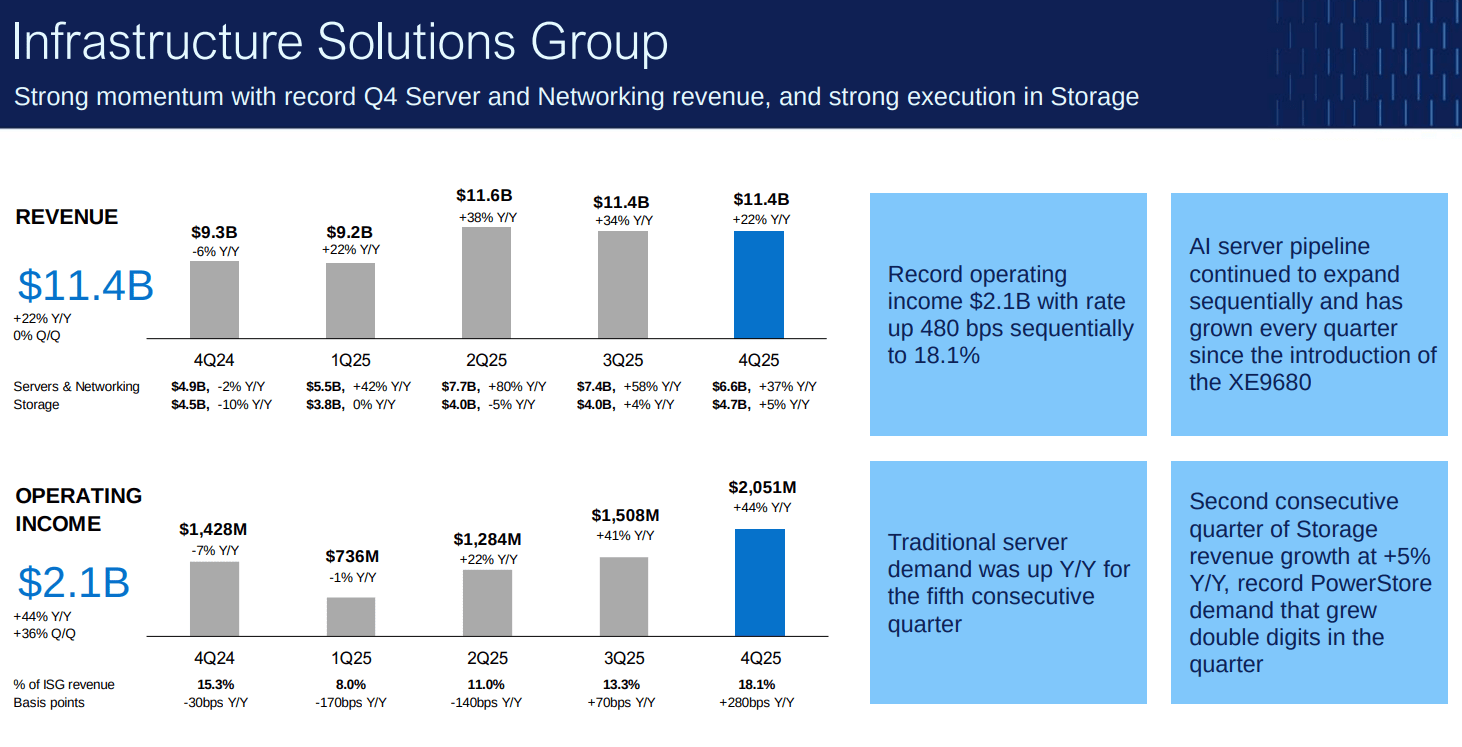
The first engine is the Infrastructure Solutions Group. This is the high-speed, high-margin business that supplies servers, networking equipment, and storage solutions to hyperscale cloud providers, enterprise data centres, and - increasingly - sovereign AI initiatives. ISG grew 29% for the full fiscal year FY25, produced record operating income of $2.1 billion in Q4 alone at an 18.1% margin, and carries a $9 billion AI server order backlog that its own CEO describes as growing "every quarter since the XE9680 was launched." This segment is a capital-light, demand-pull business with a customer concentration that reads like a who's-who of global infrastructure spending.
The second engine is the Client Solutions Group. This is the business that sells commercial PCs, workstations, laptops, and peripherals - primarily to enterprise customers. CSG has been a drag on sentiment because consumer revenues fell 12% in Q4 and overall CSG growth has been tepid. But the professional framing of CSG as a structurally declining business misses what is genuinely coming in the second half of 2025: the largest forced PC hardware upgrade cycle in over a decade. Windows 10 reaches end-of-life in October 2025. Microsoft has clearly stated there will be no extended consumer support. Hundreds of millions of enterprise PCs - many unable to run Windows 11 due to hardware incompatibility - will need to be replaced. Dell, with its 15% global commercial PC market share, captures a disproportionate share of that corporate refresh business.
- → Q4 revenue $11.4B, +22% YoY - fifth consecutive quarter of double-digit growth
- → AI server shipments $2.1B in Q4; full-year $10B; FY26 guidance $15B+
- → $9B backlog expanding every quarter since XE9680 launch
- → ISG operating margin 18.1% in Q4, up from 15.3% a year prior (+280bps YoY)
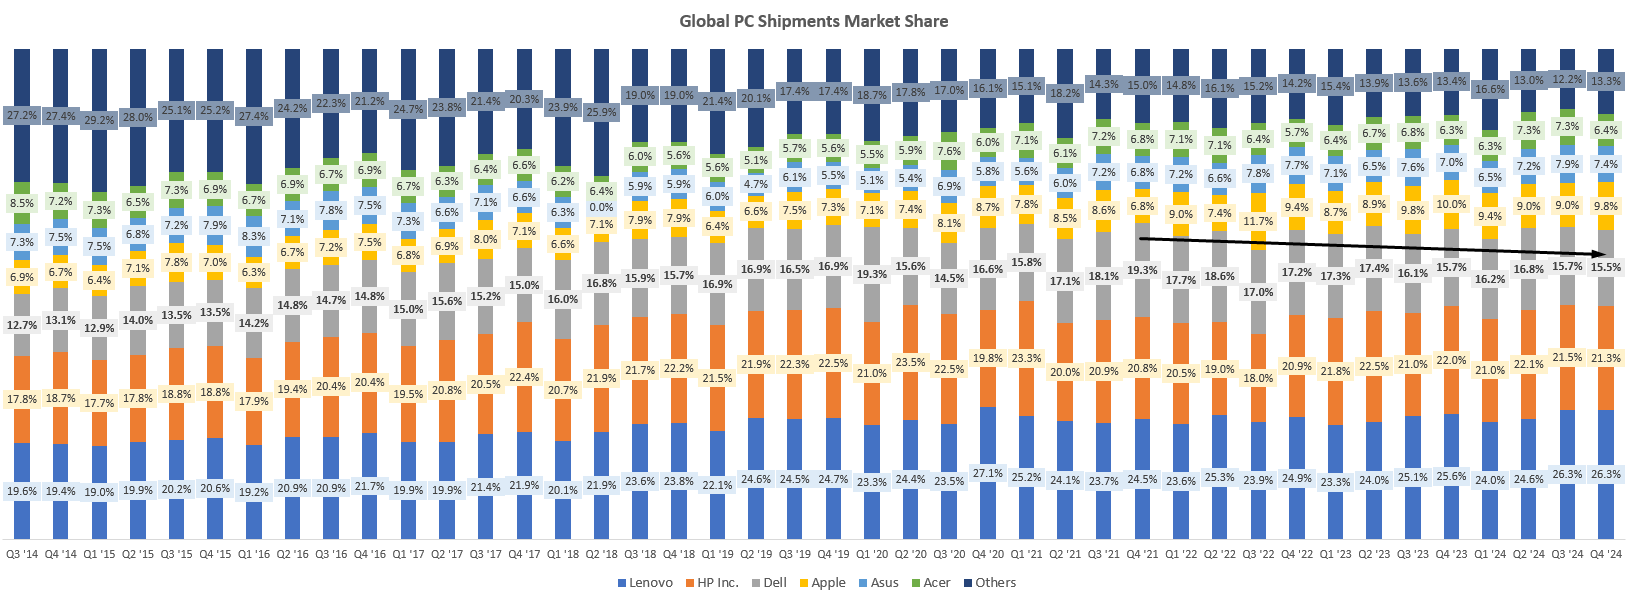
- → 30% mainstream server market share (IDC) - up 7 points since 2014
- → $5B xAI server deal (NVIDIA GPU-based cluster) announced February 2025
- → ISG now generates 76% of total segment operating income
- → Commercial revenue +5% YoY in Q4; demand "up double digits" per management
- → Windows 10 EoL October 2025 - enterprise refresh cycle beginning now
- → Windows 11 requires TPM 2.0 hardware - many enterprise PCs ineligible to upgrade
- → ~15% global commercial PC share; #3 globally behind Lenovo and HP
- → AI PCs launching mid-2025 - "Copilot+ PC" hardware adds $150–300 per unit premium
- → Consumer revenue decline (-12%) is not the core thesis - commercial is
- → CSG CAGR guidance of 2–3% conservative; refresh cycle could meaningfully exceed this
The Backlog Nobody Is Talking About
The number that I keep returning to - the number that strikes me as the most important single data point in the Dell story - is the $9 billion AI server backlog. This is not a soft pipeline figure. It is a firm order backlog: customer commitments, purchase orders, delivery schedules. And according to Jeff Clarke on the Q4 FY25 earnings call, it has grown every single quarter since Dell launched its XE9680 AI-optimised server platform.
To put that in context: Dell shipped $10 billion in AI servers across all of FY25. It is guiding to at least $15 billion in FY26. That $9 billion backlog - representing roughly 60% of the entire prior year's AI revenue - is already committed and queued. The revenue story for FY26 AI servers is not speculative. It is scheduled.
The xAI Deal. In February 2025, Bloomberg reported that Dell is set to supply $5 billion worth of NVIDIA GPU-based servers to Elon Musk's xAI for its artificial intelligence supercomputing project. That single deal, if confirmed in full, would represent approximately half of Dell's entire FY25 AI server revenue. It signals that Dell is not merely riding the AI infrastructure wave - it is operating as the preferred integration and deployment partner for some of the largest AI compute projects in the world.
What "AI Server" Actually Means for the P&L
One of the persistent bear arguments on Dell's AI exposure is that AI servers are lower margin than traditional servers - higher component cost (NVIDIA GPUs), lower gross margin percentage. This is true in isolation. But the argument misses the more important dynamic: the absolute dollar of profit per AI server is substantially higher than for a traditional rack server, because the average selling price difference is far larger than the margin percentage gap.
More importantly, what has actually happened to ISG margins tells a more optimistic story. ISG operating margin in Q4 FY25 was 18.1% - 280 basis points higher than a year ago, and 480 basis points higher than the previous quarter. ISG margins have improved as AI server volumes have scaled, because Dell benefits from a services, installation, networking, and storage attach-rate on each AI server deployment. The fuller the solution stack Dell sells, the better the blend. Management explicitly confirmed this dynamic on the earnings call, noting that FY26 AI server guidance of at least $15 billion includes attached services revenue.
Dell also commands structural advantages over pure-play competitors in the AI server market. Its 30% mainstream server market share - built over nearly a decade of consistent share gains from 23% in 2014 - gives it sales coverage, support infrastructure, and customer relationships that no start-up competitor can replicate. On storage, Dell holds 25–55% market share across all major categories. This installed base is the most durable moat in the enterprise infrastructure business.
The Mix Shift Nobody Is Pricing
Dell's margin architecture is quietly undergoing one of the most important transformations in the company's history - and the market has largely looked past it. The key dynamic is a structural revenue mix shift from lower-margin CSG toward higher-margin ISG, combined with cost discipline across the entire enterprise.
Three years ago, CSG and ISG contributed roughly equal shares of Dell's total operating income. By Q4 FY25, ISG accounted for 76% of total segment operating income - and that proportion is rising. As AI servers, storage, and enterprise networking grow faster than the PC business, Dell's blended margin profile improves mechanically, even with no improvement in any individual segment margin. Add the fact that ISG's own operating margin has simultaneously expanded from 15.3% to 18.1% in one year, and the mathematics become powerful.
Dell's overall EBIT margin of 10.2% in Q4 FY25 now sits at its highest level in several years, and the trajectory is upward. Management targets non-GAAP EPS growth of 14% in FY26, which at current consensus EPS estimates implies a path toward $9.30+ per share. On a 9× P/E, that gets you to $84. On a 12× P/E - still a discount to any peer in the AI infrastructure universe - you are at $112. On a 14× P/E, you are at $130. The case for re-rating does not require a heroic multiple expansion; it requires the market to stop applying a deep-value industrial discount to what is increasingly an AI infrastructure platform business.
One note on cash flow, because the bears will bring it up: Dell's adjusted free cash flow came in at $3.1 billion for FY25, down from $5.6 billion the prior year. The primary cause is working capital dynamics related to rapid AI server growth - specifically, the cash outflow associated with scaling inventory and supply chains to meet the backlog. This is cyclical, not structural. As the $9 billion backlog converts to revenue over the next four to six quarters, the cash conversion dynamic normalises. Management's long-run framework targets 100%+ net income-to-adjusted FCF conversion - and Dell has averaged exactly that over the past six years.
The Hardware Refresh That Reinforces the Moat
On April 8, 2025 - the day before this note was written - Dell unveiled a comprehensive refresh of its PowerEdge server and storage portfolio. The timing is not accidental. This is Dell entering the next server product cycle with aggressive specifications designed to lock in enterprise customers at precisely the moment AI infrastructure procurement is accelerating.
The new PowerEdge R770 with Intel Xeon 6 P-core processors achieves up to 80% space savings per 42U rack versus prior generations - a meaningful cost and density advantage for data centre operators facing power and cooling constraints. The R570 sets record performance-per-watt metrics on Intel benchmarks. The architecture aligns with Open Compute Project standards, which matters enormously for hyperscale customers who require disaggregated, standards-compliant infrastructure.
On storage, Dell's new ObjectScale platform (XF960 all-flash) delivers up to 2× greater throughput per node versus competing products, while its PowerProtect DD6410 appliance achieves 91% faster restore speeds and 65× deduplication ratios. These are not incremental improvements. They are the kind of step-change performance gains that shift procurement decisions in Dell's favour and drive storage refresh cycles across Dell's existing installed base of enterprise customers.
Why this matters for the thesis: Enterprise infrastructure refresh cycles typically take 18–36 months to fully play out. Dell's April 2025 hardware launches position it to capture the next wave of enterprise AI infrastructure spending - not just the hyperscale wave that is already underway, but the broader enterprise and sovereign AI build-out that is just beginning. The new product cycle is itself a catalyst for the order backlog to expand further beyond the current $9 billion.
What the Chart Is Telling Us
The most useful chart for understanding Dell's technical setup right now is not the absolute price - it is the DELL/SPX500 relative strength ratio on a monthly timeframe. This chart shows you not just where Dell has traded, but how it has performed against the broadest measure of the market.
What you see is a stock that rallied sharply relative to the S&P 500 through late 2023 and into May 2024 - the AI infrastructure re-rating wave - and has since given back most of that outperformance in an orderly but persistent underperformance phase through early 2025. The ratio has now returned to the same horizontal support level that held multiple times between mid-2023 and early 2024. Critically, the most recent monthly candles show extended wicks to the downside - a technical signature of slowing seller momentum rather than capitulation.
The annotation on the chart is direct: "Presence of wicks indicates slowing seller momentum" and "Expecting a bullish push up." On an absolute basis, Dell stock at $80–$87 is testing levels that previously served as strong support during the initial AI infrastructure rally. The relative setup - DELL vs. SPX at monthly support - combined with an improving fundamental picture creates what I consider a technically favourable entry window.
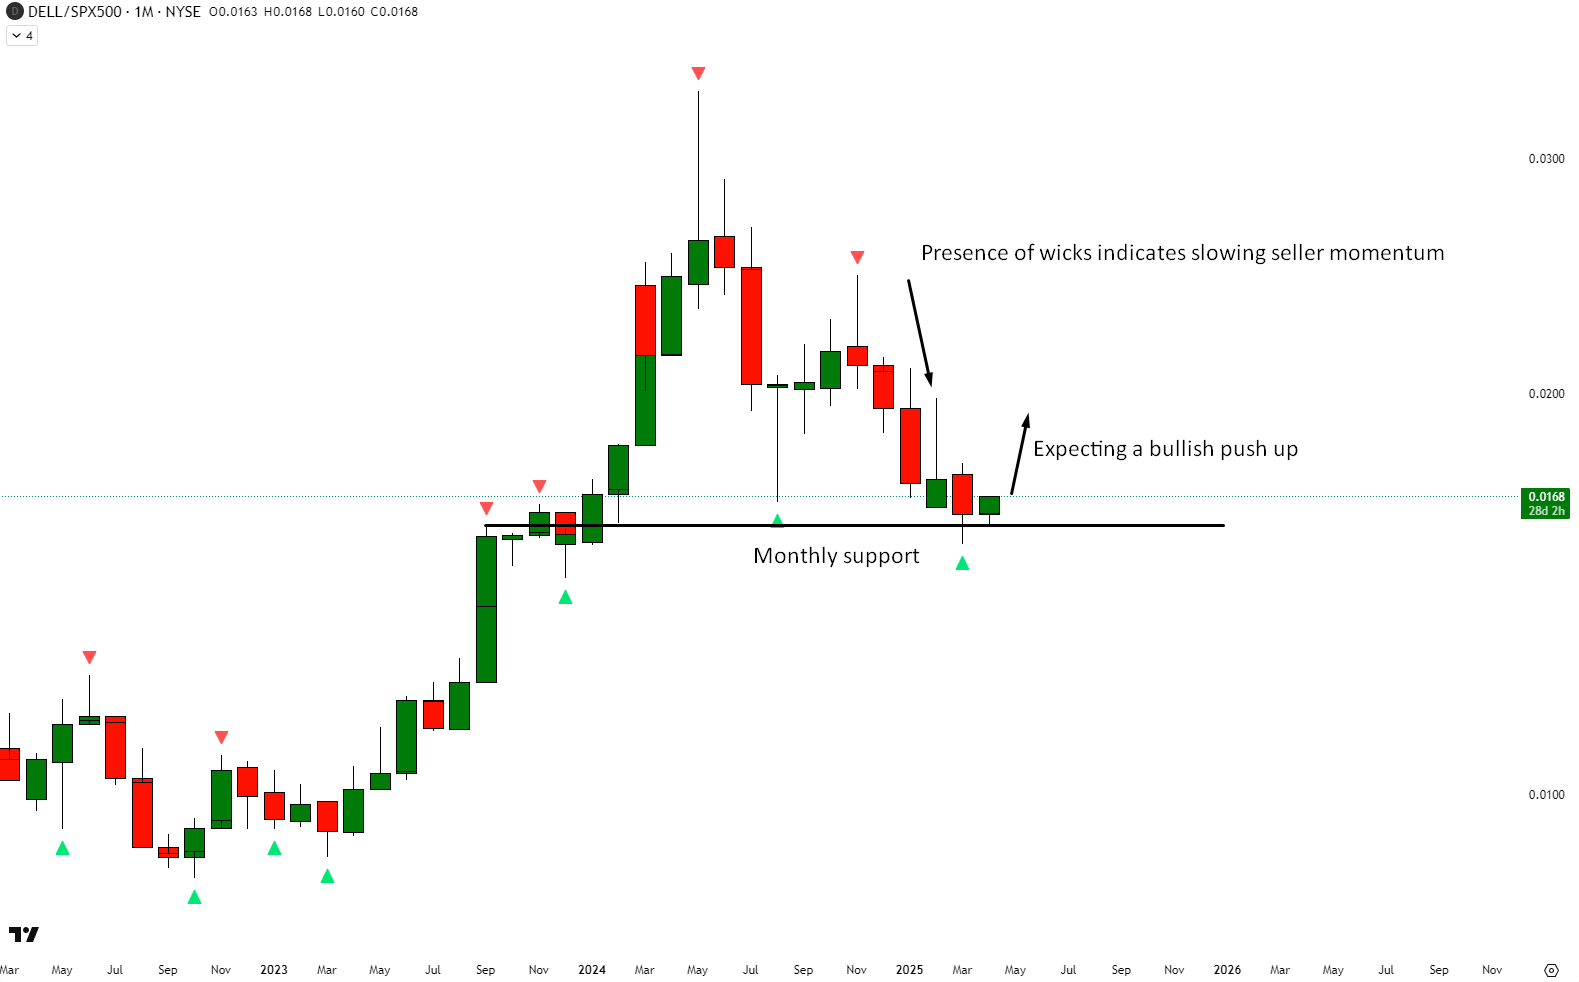
From an absolute price perspective, the $80–$87 zone corresponds to a level from which Dell previously launched its AI infrastructure re-rating move in mid-2023. Buying at a price that previously served as a launching pad, when the fundamental drivers that caused that launch are now materially stronger, creates the kind of asymmetric setup this thesis is built on.
The Bearish Arguments - and Why They Don't Hold
I try to take the opposing case seriously. If the market is pricing Dell at 9× forward earnings while competitors trade at 15–20×, there is presumably a reason. Here is my honest assessment of the strongest bear arguments - and my response to each.
What Should Dell Trade At?
The valuation case for Dell does not require predicting the future with precision. It requires answering a simple question: what is the fair earnings multiple for a company that generates $9+ EPS, grows that EPS at 12–14% annually, has a $9 billion backlog in a high-growth market, and is actively buying back its own stock at a 9× P/E?
Goldman Sachs maintained a Buy rating on Dell with a $130 price target in its most recent research note, citing AI infrastructure exposure and the PC refresh cycle. Seeking Alpha analysts converge on a fair value range of $120–$145. Our own base case, using FY26 consensus EPS of approximately $9.50 and applying a 14× multiple - still a meaningful discount to the S&P 500 average - produces a price of $133. The framework below shows the range of outcomes across bear, base, and bull scenarios.
| Scenario | FY26 Non-GAAP EPS | P/E Multiple | Implied Price | Return from $84 | Key Assumption |
|---|---|---|---|---|---|
| Bear | $8.80 | 10× | $88 +5% |
Modest loss from entry - well above the hard stop at $65 - representing a scenario where AI spending slows but Dell's core business remains intact. The $65 stop is reserved for deeper fundamental deterioration. | AI server miss, CSG flat, macro headwind compresses multiple |
| Base | $9.50 | 14× | $133 +58% |
Target zone: $126–$140 | $15B+ AI servers, commercial PC recovery, modest re-rating to peer discount |
| Bull | $10.50 | 15× | $158 +88% |
Upside scenario if AI orders surpass guidance | AI backlog accelerates beyond $15B, xAI deal confirmed, PC cycle beats, multiple re-rates to peer group |
EPS estimates sourced from FY25 actuals ($8.14 non-GAAP) and company guidance of 14% EPS growth in FY26. Multiple ranges based on peer comparison: HP Inc (~10×), HPE (~12×), S&P 500 average (~21×), sector AI infrastructure peers (~18–25×). All figures are estimates; not financial advice.
The Events That Drive the Re-rating
One of the underappreciated features of this trade is the density of near-term catalysts. Across both ISG and CSG, there are multiple discrete events over the next 12 months that can each independently contribute to a re-rating. Below is the ladder, roughly in chronological order.
The Position
The following scenarios reflect the author’s personal analysis and are not investment recommendations. See our full disclaimer.