There are two kinds of selloffs in consumer brands. The first is the structural kind - where the product cycle has peaked, a new competitor has eaten the shelf, and the moat has quietly been filled in. The second is the sentiment kind - where the macro narrative overwhelms the operating reality, and the stock gets sold down to a price that assumes the business is permanently broken. Spotting the difference is where alpha lives.
e.l.f. Beauty is the second kind. The stock fell 77% from its all-time high of ~$218 to a low near $50 - a drawdown that would make even the most committed long-term investor question their conviction. But look at what happened to the actual business during those seventeen months: e.l.f. delivered 24 consecutive quarters of net sales growth and retail market share gains. The brand became the #1 mass cosmetics brand in the United States by units sold. International revenue grew 66% year-on-year. Digital commerce hit 24% of total sales. Their loyalty programme added a million new members. The business didn't break. The narrative did.
We are initiating with a Bullish view and an entry zone of $65–$70. At that price, you are buying a 71% gross margin business with demonstrated pricing power, a $500M buyback programme representing roughly 17% of the current market cap, and a technical setup - specifically, the PPO momentum indicator crossing above its signal line from a deeply oversold -20 level - that historically marks the end of capitulation selling. The market is discounting permanent stagnation. We think the story is about recovery, not deterioration.
e.l.f. at a Glance
Five Years of Growth: The Revenue Arc
e.l.f. Beauty's revenue story is not the kind that most investors would call boring. The brand has compounded from a $266 million specialty cosmetics company in fiscal 2020 to a $1.3 billion revenue business in fiscal 2025 - a 309% increase in five years, with double-digit growth in every single year of that run. The $1 billion milestone was crossed in fiscal 2024, making e.l.f. the first mass cosmetics brand to reach that level in less than a decade from its rebranding.
What is particularly striking about the growth arc is its consistency. This isn't a one-year tariff-import arbitrage story, or a post-COVID pent-up demand bounce. It is systematic execution: introducing new SKUs, expanding in-store footage at major retailers, building a digital DTC flywheel, and entering new international markets - simultaneously, year after year. The FY2026 consensus of $1.31B (+10.7% YoY) is notably more conservative than recent growth rates, reflecting tariff uncertainty - which creates exactly the kind of expectations reset that sets up a beat.
Annual Net Sales - Fiscal Years Ending March
The Consumer Moat - Market Position & Loyalty
The word "moat" gets thrown around carelessly in equity research. A moat is not just a good product - it is a structural advantage that makes the business difficult to displace even when a competitor wants to. For e.l.f., the moat has three components: retail shelf positioning, a loyalty ecosystem, and price-to-value pricing power that occupies a gap no competitor has successfully colonised.
The Beauty Squad - Loyalty Engine
The national picture confirms the retail-level data: e.l.f. is the #1 mass cosmetics brand in the United States by units sold, holding approximately 14% of unit market share. That is a competitive position most investors underestimate - because they are comparing dollar share (where premium brands like Estée Lauder appear larger) rather than the unit metric that actually tells you who wins in a tariff-driven, trading-down environment. When consumers feel squeezed, they do not abandon makeup - they trade down to the brand that already owns the value tier. That brand is e.l.f.
The e.l.f. Labs division - which recently inked a $3.5 million deal - signals the brand's ambition to move beyond commodity SKUs into science-backed innovation, protecting the margin profile from pure price competition. This is a secondary story today; it matters more in 2026–2027.
What the Market Got Wrong
Between the summer of 2023 and the spring of 2025, e.l.f. Beauty's stock fell from a peak near $218 to a low around $50. The narrative at the bottom was a toxic cocktail: tariff escalation fears hitting an 80% China-sourced brand, a slowing US consumer, whispers of gross margin compression, and a general rotation out of high-multiple small caps. It was enough to push the stock into freefall - despite the underlying business never actually missing a growth quarter.
The most important thing to understand about this drawdown is what it was not. It was not a loss of shelf space. It was not a product cycle failure. It was not a competitor capturing meaningful share. It was not a CEO change. It was not a balance sheet crisis. The company's institutional followers - the analysts who track channel data and do field work at Target and Walmart - consistently reported that in-store performance remained strong throughout the selloff. The stock and the business were disconnected.
The stock has since bounced roughly 30%+ from those lows - which is how we arrive at the $65–$70 entry zone. We are not buying the absolute bottom. We are buying the confirmation that the capitulation selling is over, the technicals are turning (the PPO crossover is the trigger), and the fundamental story has not changed. If anything, the tariff pause has actually improved the near-term risk/reward.
Tariff Stress Test - 80% China Exposure
I am not going to minimise the tariff risk here, because it is real and it is the biggest single bear case. Approximately 80% of e.l.f. Beauty's products are manufactured in China. At the peak of tariff escalation earlier this year, the reciprocal tariff rate hit 125% - a number that, applied naively to e.l.f.'s cost structure, would obliterate gross margins. This is why the stock sold off as hard as it did.
But the actual picture is more nuanced, and the company has responded with two concrete strategies. First, the US and China agreed to a 90-day tariff truce in May 2025, reducing the reciprocal rate from 125% to 10% - buying the company time to negotiate, diversify, and reprice. Second, management announced a $1 per unit price increase effective August 1, 2025 - a direct pass-through of incremental tariff costs that is well within what the brand's price-to-value positioning can absorb without driving consumer substitution.
The key takeaway is this: the tariff risk is the variable that determines whether this trade works. But the market has been pricing the stock as though Scenario A is certain - when in reality, we are sitting in Scenario B with an active 90-day truce, a price hike in place, and management sourcing diversification underway. The asymmetry favours the bull.
Margins, Earnings & Valuation
One of the most misunderstood aspects of e.l.f. Beauty is the margin profile. A 71% gross margin in a company that sells lipstick and mascara for $10–$14 per unit sounds impossible. But it reflects the business model: a vertically integrated supply chain, direct manufacturing relationships in China, and a product architecture that emphasises formulation quality over expensive ingredients. The margin is structurally supported, not a transient effect of revenue scale.
| Company | Gross Margin | Fwd P/E (FY+1) | Revenue Growth (Last FY) | Note |
|---|---|---|---|---|
| e.l.f. Beauty (ELF) | 71.1% | ~19× at $65 | +27% | Entry zone - undervalued vs. peers |
| L'Oréal (OR.PA) | 73.4% | ~28× | +5.6% | Premium justified by brand portfolio breadth |
| Estée Lauder (EL) | 72.8% | ~35× | −6.5% | Declining revenue, yet higher multiple |
| Coty (COTY) | 63.2% | ~14× | +5.1% | Lower margins, slower growth |
| Revlon (post-reorg) | ~52% | N/A | Flat | Not a relevant peer; shown for context only |
At the $65–$70 entry zone, ELF trades at approximately 19–21× FY2025 GAAP EPS of $3.33, and at 18–20× FY2026 consensus EPS of $3.45. By FY2027, consensus EPS rises to approximately $3.98–$4.07, implying a forward P/E below 17× at today's price. That is a consumer staples brand growing at 10–27% annually trading at a growth discount to legacy peers that are barely flat. The argument for the valuation discount - tariff risk - is real but already priced in at these levels.
One legitimate concern raised by analysts is the stock-based compensation load. SBC ran to approximately $57 million in the first nine months of FY2025 alone - which means adjusted EBITDA materially overstates real earnings power. We are using GAAP EPS throughout this note for that reason. Even on a fully diluted GAAP basis, the valuation is compelling.
Analyst Consensus - 22 Ratings
Of the 22 analysts covering ELF, 14 maintain Buy or Strong Buy ratings despite the drawdown. The majority of Hold and Sell ratings focus on tariff risk and near-term growth deceleration - concerns we believe are either already priced in or manageable through the strategies described above.
Technical Setup - The PPO Crossover
The fundamental case is strong. But it is the technical picture that creates the timing conviction needed to act at these levels rather than waiting for further confirmation - which, in momentum markets, tends to arrive just as the easy money has been made.
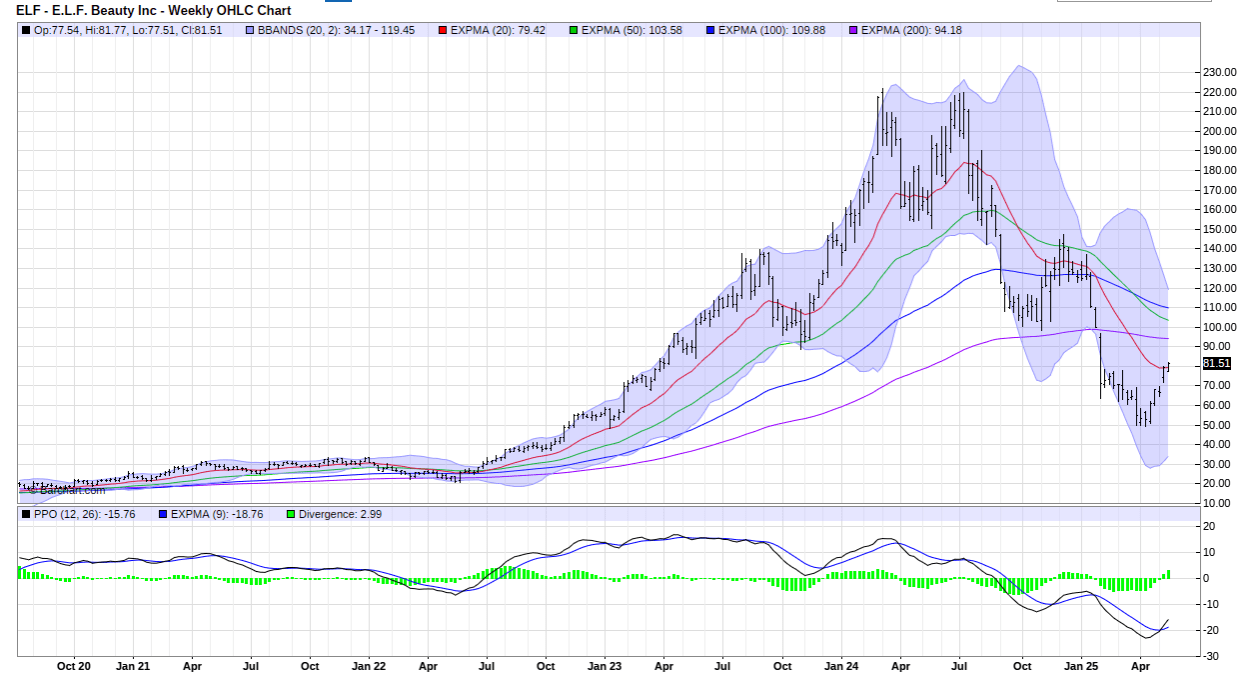
The Percentage Price Oscillator (PPO) is a momentum indicator analogous to the MACD but expressed as a percentage, making it comparable across stocks at different price levels. On the weekly chart, the PPO had reached approximately -15.76 - a reading that historically corresponds to capitulation-level oversold conditions in individual stocks. The indicator then crossed above its signal line with a positive divergence of +2.99, providing a technical confirmation that downside momentum is exhausting. As one technical analyst put it: "When a PPO crosses above signal from the -20 zone, it is more often a long-term discount situation than the beginning of further deterioration." The weekly chart is confirmed - we are not seeing noise.
The broader technical picture supports the same conclusion. The stock recovered from its ~$50 low to the $80+ range, and at the time of writing is consolidating near $65–$70. The MA(20) at $79.42 and MA(200) at $94.18 sit above the entry zone as overhead resistance levels - the stock needs to reclaim these averages on its recovery path toward the price targets. The Bollinger Bands span from $34 to $119, which is unusually wide for this name - confirming the extreme volatility that accompanied the drawdown and suggesting significant mean-reversion potential.
At the time of this writing, ELF trades near $81. The $65-$70 entry zone represents a pullback of approximately 14-19% from current levels - a meaningful dip that requires either patience or a catalyst-driven correction. Readers should treat this as a limit order setup rather than a market order entry, monitoring for a return to the zone before committing capital. The technical case for the entry zone is that $65-$70 coincides with the PPO crossover confirmation level and the post-capitulation consolidation range where the risk/reward is most asymmetric. Chasing at $81 materially compresses that asymmetry.
Bear / Base / Bull - Three Paths
The risk/reward at the $65–$70 entry zone reflects these asymmetric probabilities. The bear case ($40–$50) requires a full tariff reinstatement AND a consumer behaviour shift - two independent adverse events occurring simultaneously. The base case requires only that things don't get worse. The bull case requires only a partial re-rating to historic trading multiples.
Catalyst Watch - What Moves the Stock
Bear Case Q&A - The Honest Answers
The Trade
The following scenarios reflect the author’s personal analysis and are not investment recommendations. See our full disclaimer.
The thesis is simple, even if the operating environment is not. e.l.f. Beauty is a 71% gross margin, 24-consecutive-quarter growth brand that fell 77% from its peak because of macro fear, not business failure. The stock is now recovering, the technical momentum is turning, management is executing a tariff mitigation playbook, and the $500M buyback programme provides a powerful floor. The entry zone of $65–$70 represents a compelling risk-adjusted opportunity with a 1:2.8 risk/reward profile.
There is one thing I keep coming back to with e.l.f. Beauty: the 24 consecutive quarters of growth. In any sector, that kind of consistency commands respect. In consumer goods, where shelf space is a finite resource, category trends shift with economic cycles, and Gen Z brand loyalty is supposedly non-existent, it is remarkable. The market is treating this company as though those twenty-four quarters never happened - or as though the twenty-fifth quarter will be the one where everything breaks. I think that is the wrong frame. The better frame is: a resilient consumer brand that found itself on the wrong side of a trade war, doing everything right to mitigate it.
Disclosure: This analysis is published for informational and educational purposes only. It does not constitute investment advice or a recommendation to buy or sell any security. All data referenced is sourced from public filings, analyst reports, and third-party research as of May 9, 2025. Past performance is not indicative of future results. Please see our full disclaimer.