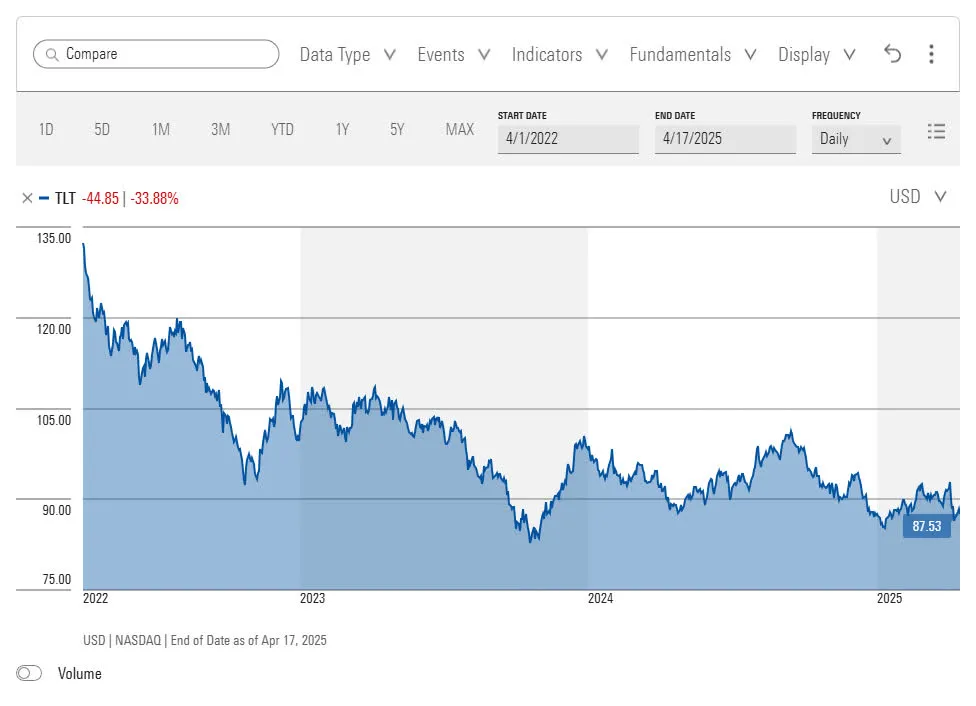
Long-duration Treasury bonds are, in most years, the least exciting asset class in a portfolio. They don't announce earnings beats, don't split their stock, and don't issue press releases about product launches. They simply reflect what the market believes about the future path of interest rates - and right now, that reflection shows a bond that has fallen 48% from its 2020 peak, resting at the floor forged by the most aggressive rate-hiking cycle since the early 1980s.
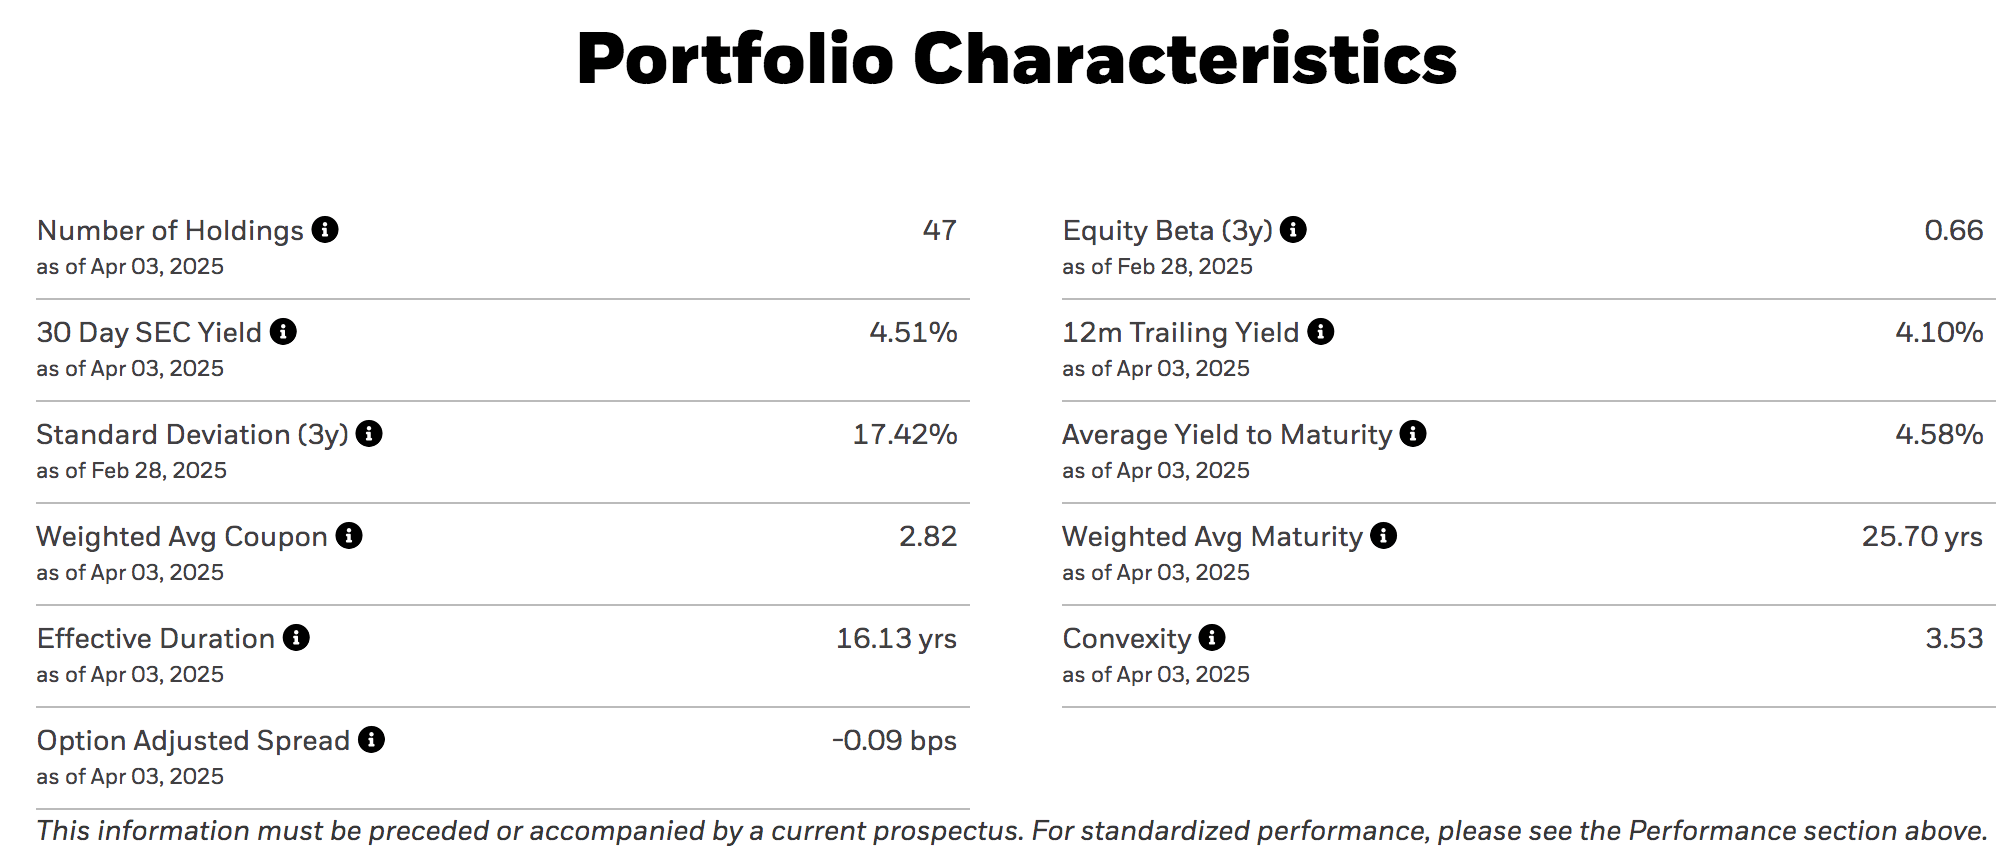
The iShares 20+ Year Treasury Bond ETF (TLT) is currently trading in the low $80s - a price range that has historically served as a structural floor. The fund holds U.S. government-backed bonds with maturities beyond 20 years, carries an effective duration of 16.13 years, and distributes income monthly. With each 1% decline in long-term interest rates, the fund's net asset value would be expected to rise approximately 16%, mechanically and predictably. That relationship between rate cuts and price appreciation is the central architecture of this analysis.
What makes the current setup compelling is not simply that yields are elevated - they are - but that the macro backdrop has shifted meaningfully toward a scenario where rates come down. Trade war escalation, slowing consumer sentiment, and rising recession probability estimates at major institutions are creating conditions historically associated with Fed pivots. We are not predicting when. We are observing that the asymmetry - a 4.5% yield while waiting, limited new downside from a structural floor, and double-digit price upside per rate-cut increment - is unusually well-aligned. This memo explains the framework behind that observation.
TLT is the largest and most liquid long-duration Treasury ETF in the world, managed by BlackRock's iShares division. With over $58 billion in assets under management, its daily trading volume routinely exceeds $3 billion - making it one of the most widely-tracked rate instruments available to retail and institutional investors alike. The fund provides exposure to U.S. Treasury bonds with 20+ years to maturity, though its effective duration (the more accurate sensitivity measure) sits at 16.13 years, reflecting the weighted average of its current portfolio.
Two structural characteristics are worth highlighting beyond the headline numbers. First, TLT carries a convexity of 3.53 - a property that makes its price gains accelerate faster than its price losses for equivalent rate moves. If rates fall by 1%, the fund gains more than it loses from a 1% rise. This asymmetry is baked into the bond mathematics and works in the holder's favour in a declining-rate environment. Second, the fund's negative option-adjusted spread confirms it behaves as a flight-to-quality instrument - when credit risk spikes in equities, Treasuries benefit from safe-haven flows, providing a natural hedge against equity market stress.
The fund's 0.15% expense ratio is one of the lowest in the fixed-income ETF universe. Compounded over ten years, total fee drag amounts to approximately 1.51% - a figure that becomes economically trivial when positioned against the magnitude of potential capital appreciation in a rate-cutting cycle. Monthly distributions further improve the practical proposition: income is returned to investors every calendar month, reducing liquidity risk compared to quarterly or semi-annual structures. Since inception in 2002, TLT's income component has come predominantly from coupon income rather than capital gain distributions - a stable, predictable structure that does not depend on market timing.
The 2025 macro environment for long-duration bonds is genuinely contested. Understanding why requires holding two arguments simultaneously - not dismissing either one - because both are grounded in real economic dynamics. The resolution of this tension is what ultimately drives TLT's price path. Here is the honest framework:
The analytical view here is that both forces exist, but they resolve at different timeframes. Tariff-driven inflation is largely a short-term supply shock - most historical episodes of tariff-related price spikes moderate within 12–18 months as supply chains adjust or demand softens. Recession risk, on the other hand, compounds: each month of elevated uncertainty tends to deepen it. The bond market is beginning to price this sequencing - yields on the 16–20 year segment remain pent-up relative to the short end, giving investors the opportunity to lock in current yields before the market fully reprices for a slowdown. The U.S. yield curve flattened materially in the month following the tariff announcement, and an inversion or further flattening would reinforce the recession thesis.
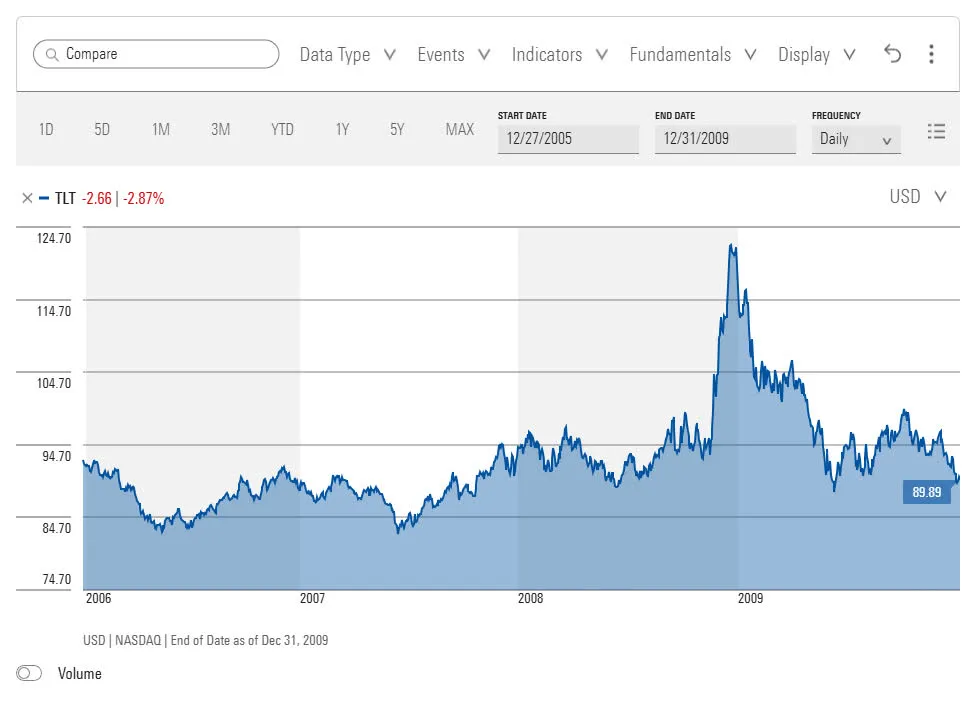
There is a widely-repeated view that investors should wait for a yield curve inversion before entering TLT. The logic is intuitive: an inverted yield curve signals recession, recessions cause rate cuts, and rate cuts lift long bonds. Follow the chain. But when tested empirically against TLT's actual price history, the signal fails as a timing tool in a meaningful way - and understanding why is important for framing the current entry rationale.
TLT has existed since 2002, which allows for a three-event sample across yield curve inversions. The results are instructive:
| Inversion Date | Recession Declared | Lag (Months) | TLT After Inversion | TLT Breakout Trigger |
|---|---|---|---|---|
| December 27, 2005 | Late 2007 | ~23 months | Lost ~10% initially | Recession announcement |
| August 27, 2019 | Early 2020 | ~5 months | Flat then rallied late 2019 | Recession announcement |
| April 1, 2022 | Not yet declared | Ongoing (>30 mo) | Entered a bear phase | Still awaiting signal |
The conclusion from all three cases is consistent: the primary price signal for TLT is not the yield curve inversion itself - it is the official recession announcement. TLT does not rally at the time of inversion; it tends to wait until the economic deterioration is formally acknowledged. But that creates a practical problem: no investor - not even the Federal Reserve - can know precisely when a recession will be declared. Waiting for the announcement risks missing a significant portion of the move, as TLT front-runs the formal declaration by 1–3 months in most cases. The 2022 inversion represents a cautionary tale: it has become one of the longest-lasting inversions in recorded history without a recession following - rendering the inversion signal itself unreliable as a standalone indicator.
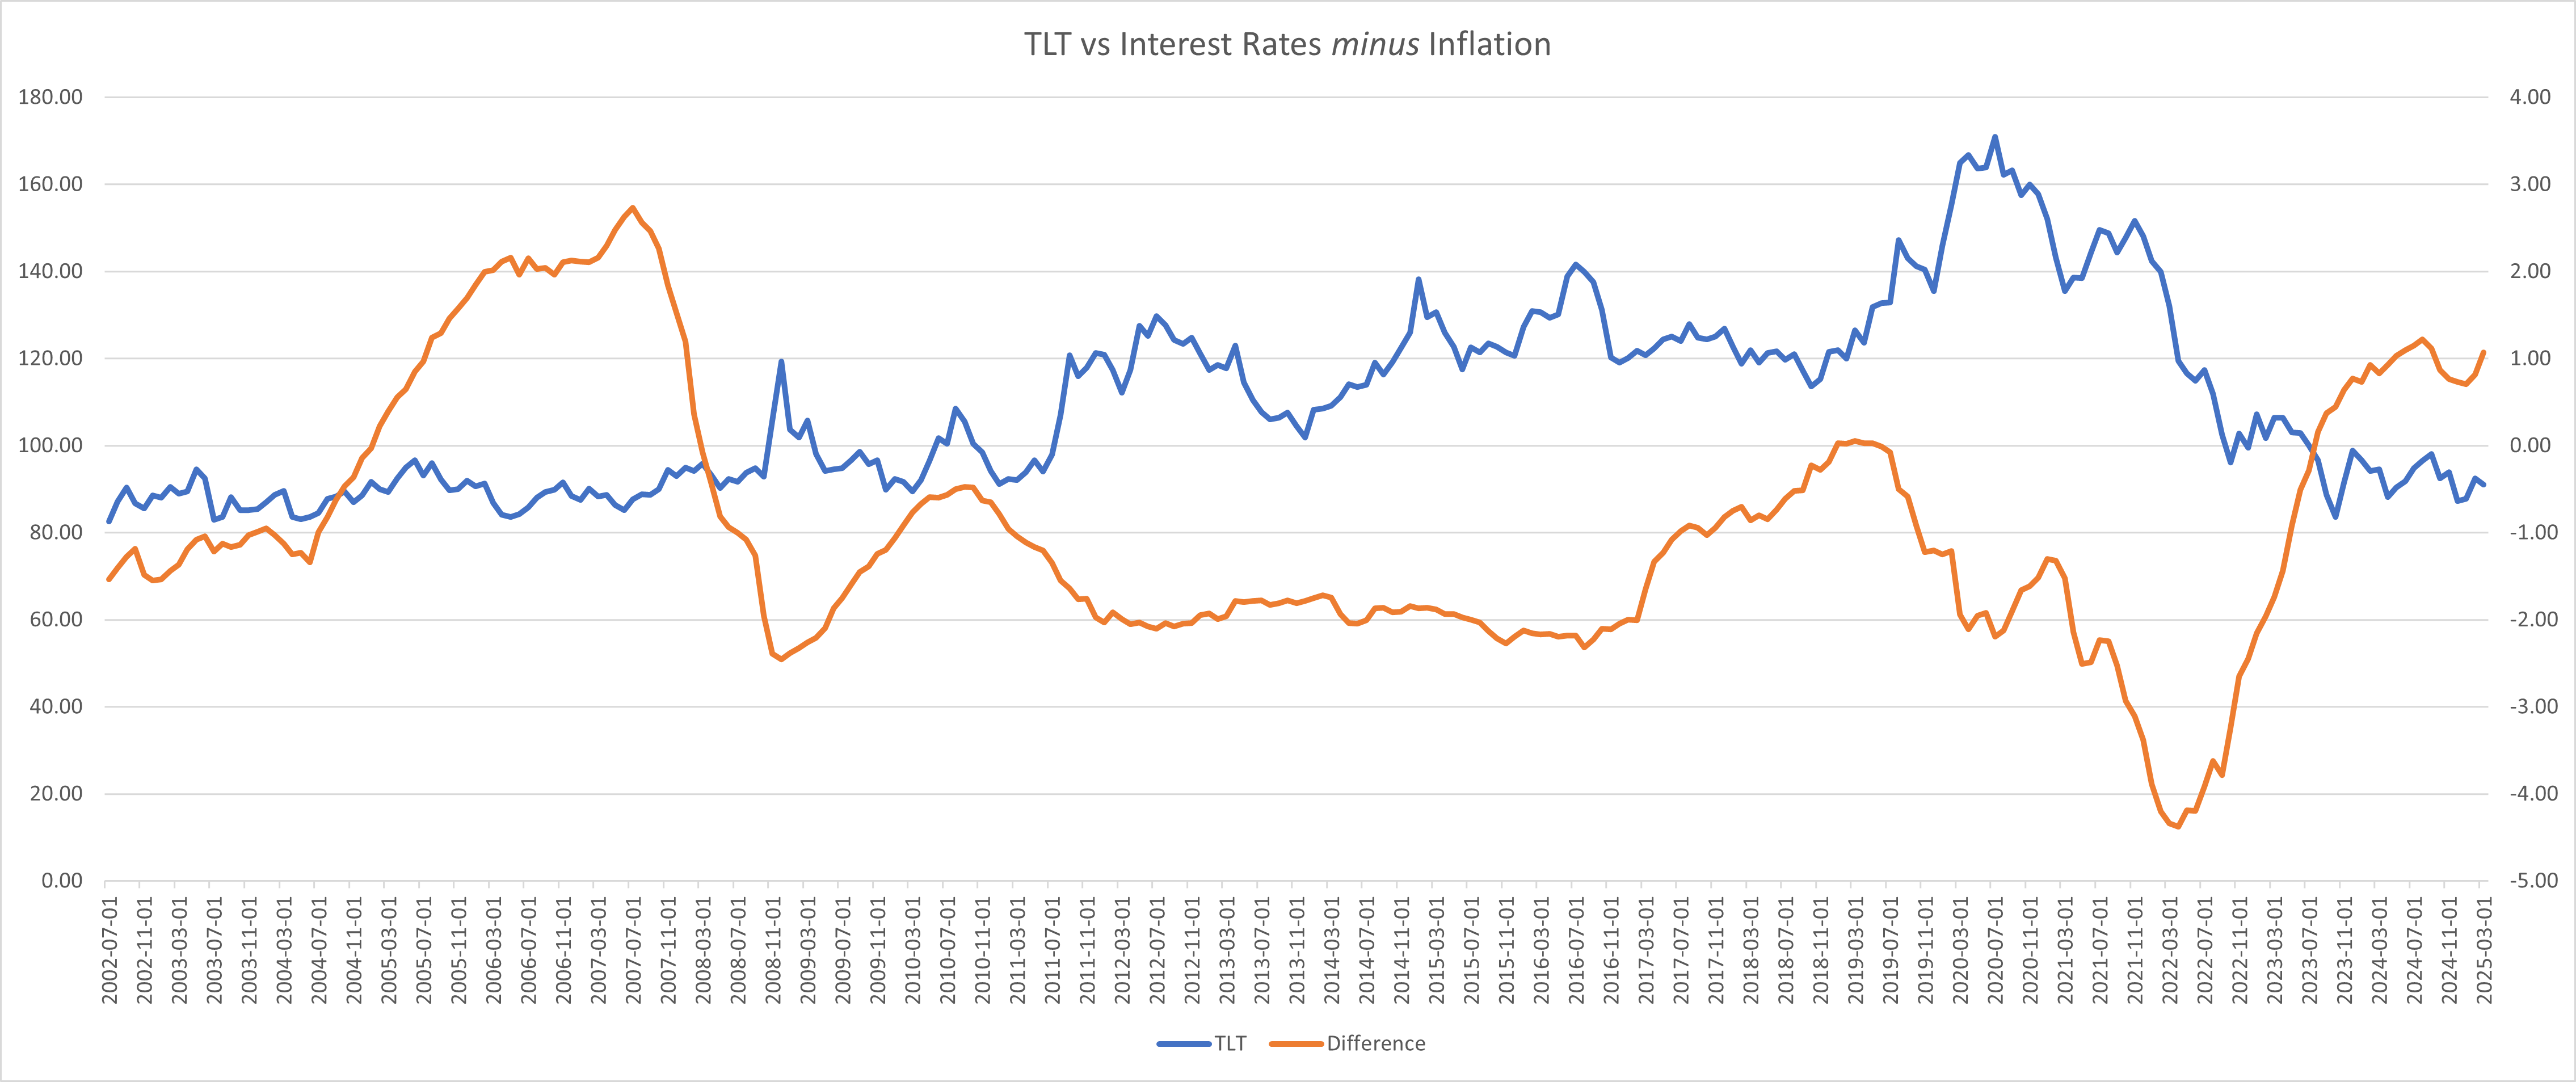
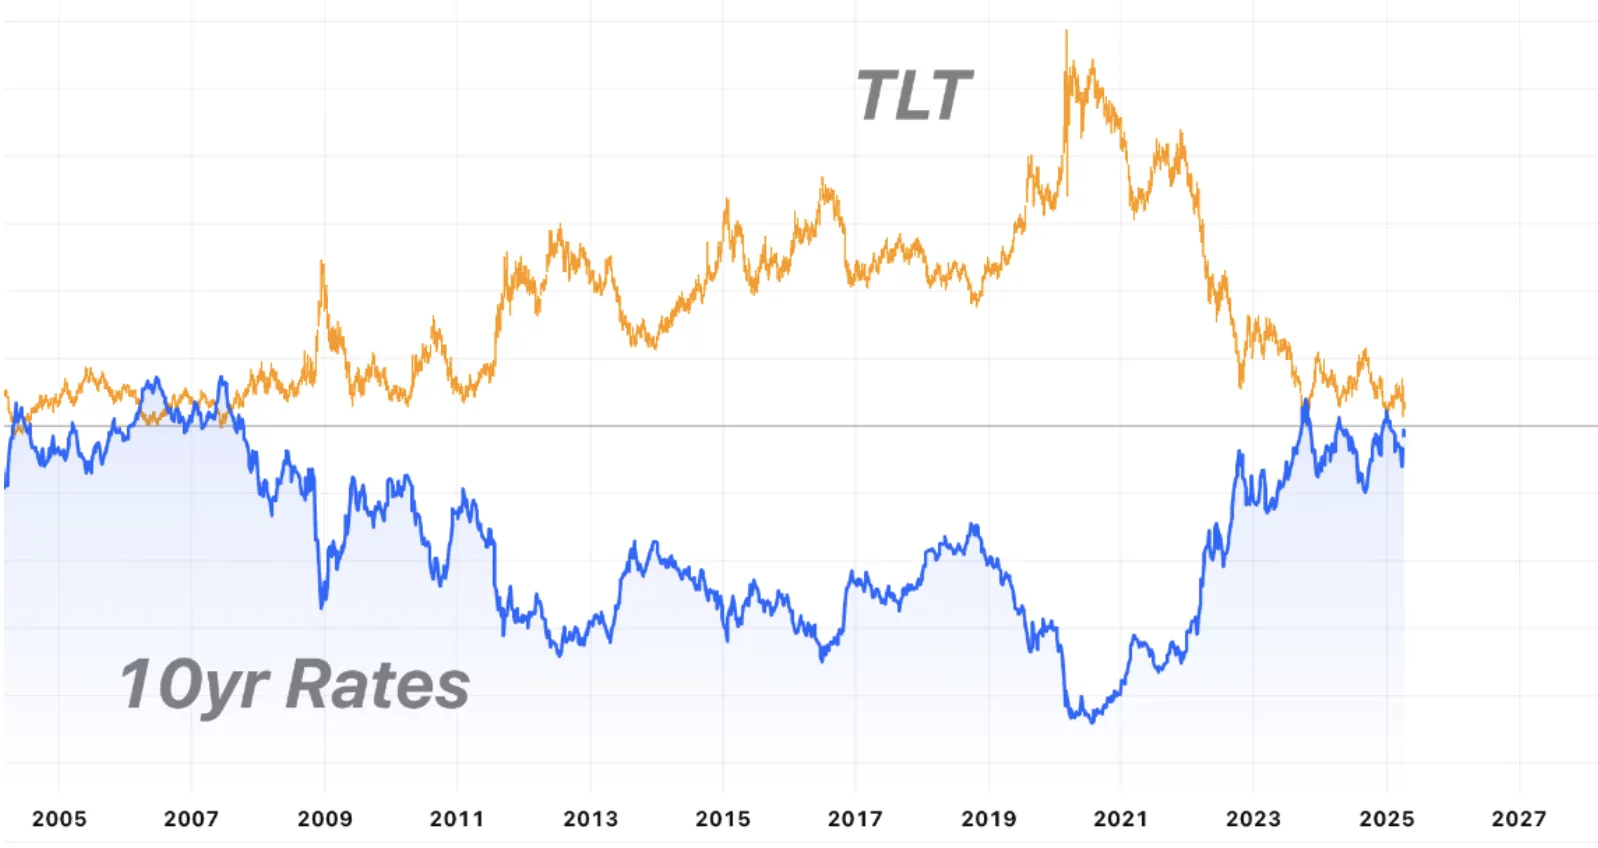
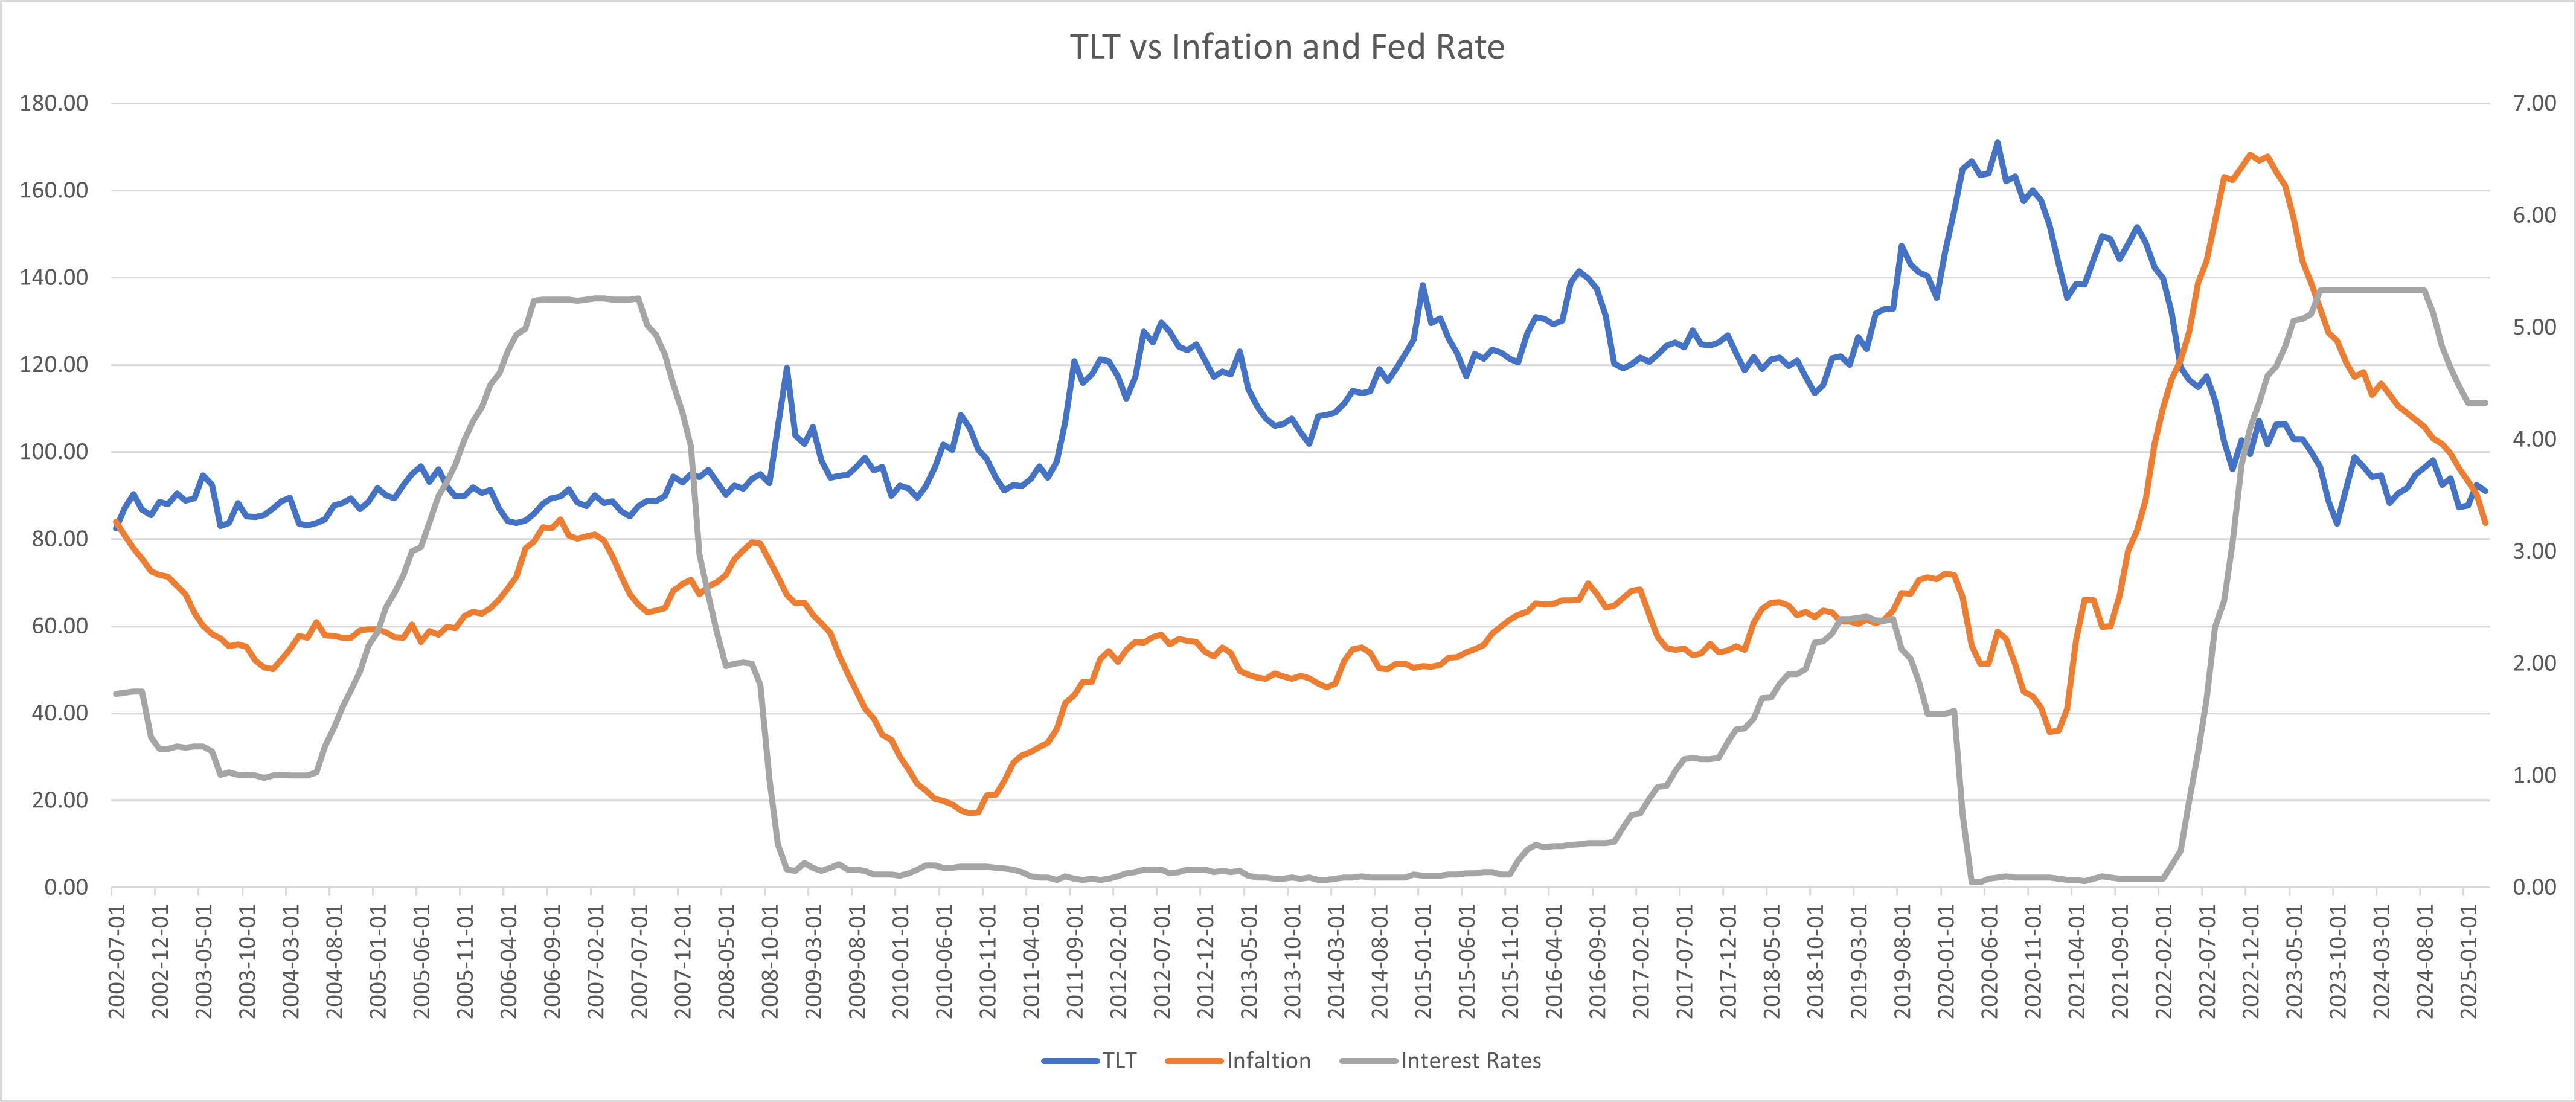
If yield curve inversions are an imprecise timing tool, what actually drives TLT breakouts? The answer, backed by the fund's full price history since 2002, is the relationship between nominal interest rates and inflation - specifically, the point at which the two converge. When the real interest rate (nominal rates minus inflation) approaches zero, TLT has historically broken out to the upside in a sustained and significant way.
Two prior breakouts are particularly instructive. The first ran from approximately November 2008 through January 2015 - TLT rose from roughly $90 to $135, a 50% gain over seven years, coinciding with the Fed's post-financial crisis rate suppression and zero-interest-rate policy. The second breakout occurred between October 2018 and July 2020 - TLT moved from ~$110 to ~$170, a 55%+ return in under two years, triggered by the Fed's rate-cutting pivot and the COVID-driven emergency cuts that followed. In both instances, the precondition was the same: inflation and interest rates converged, compressing real rates toward zero.
Real interest rates are not at zero today - and being honest about that matters. The current setup is not yet at the classic breakout trigger, which is why this analysis is framed around a 9–12 month horizon rather than an immediate catalyst. But the directional trajectory is relevant: inflation has been declining from its 2022 peak while the Fed has held rates elevated, and the trajectory points toward eventual convergence. More importantly, TLT at $84–$85 has demonstrated deep structural support - the $84–$85 range represents the floor established during the most aggressive rate-hiking cycle since the early 1980s, with TLT holding this level through over 30 months of historically elevated rates from 2022 to 2024, making it a durable structural support anchored by the extreme end of the post-GFC rate normalisation cycle. The floor is historically tested and confirmed. Investors who position at or near this level are effectively buying into a bounded-downside, open-upside setup that compounds with every month of distribution collected.
To be clear about what this entry represents: the real-rate crossover that has historically triggered sustained TLT breakouts has not yet occurred. Real rates remain in positive territory. What we are entering is the pre-crossover setup - the environment where the trigger's approach becomes increasingly probable, not where it has been confirmed. The thesis is a bet on convergence, not a bet on a confirmed signal. Risk is sized accordingly: the position builds toward a real-rate crossover that we expect within 12-18 months, not one that is happening today.
Duration is the bond market's leverage lever. Unlike equities where the mechanism between a catalyst and a price outcome can be murky, the relationship between interest rate changes and TLT's price is defined by mathematical identity. Understanding this relationship is essential for framing the target zone and the scenario analysis that follows.
With an effective duration of 16.13 years, TLT is expected to change in price by approximately 16.13% for every 1% (100 basis points) move in corresponding yields. If long-term yields fall by 1%, TLT should rise approximately 16%. If they fall by 2%, TLT should rise approximately 32%. Convexity adds a further refinement: the gains from falling rates accelerate slightly faster than the losses from rising rates - asymmetry that works in the holder's favour.
The target zone of $93–$96 therefore corresponds to a scenario where long-term yields decline by roughly 50–75 basis points from current levels - a move the market could easily achieve through a combination of 2–3 Fed rate cuts over the target horizon plus incremental flight-to-safety demand from an ongoing risk-off environment. The base case does not require an aggressive recession; it simply requires that the trajectory of rates continues downward, which the Fed's own guidance and Goldman Sachs' 45% recession probability estimate both support.
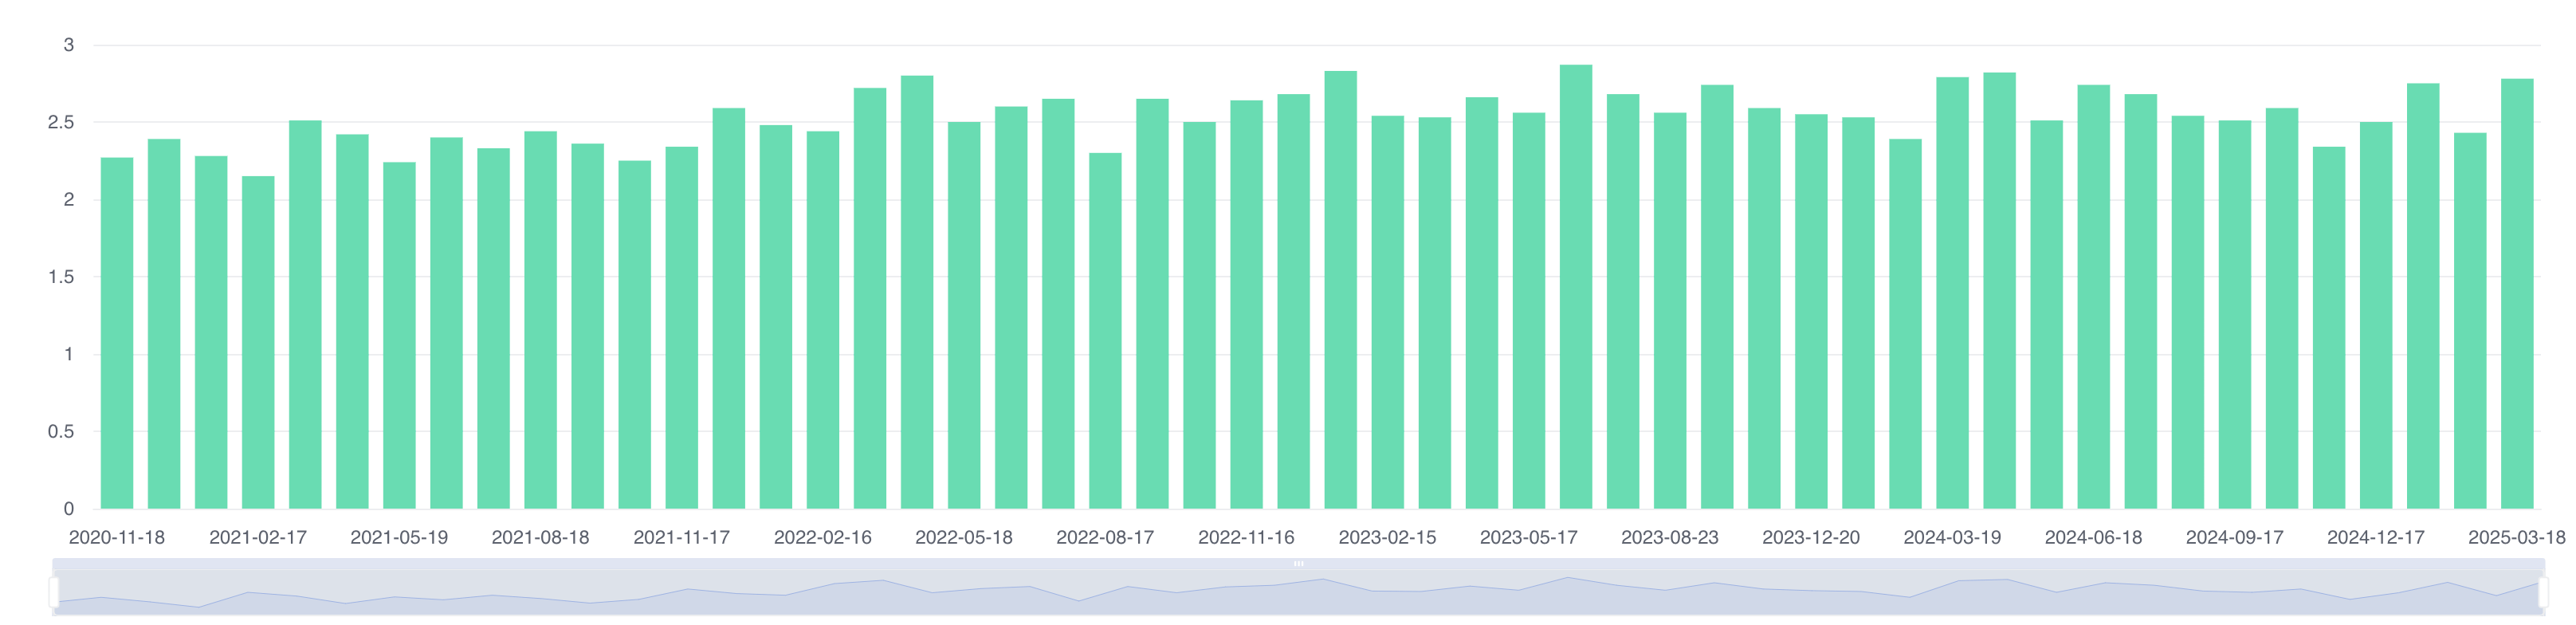
One additional benefit at the current entry level deserves mention: a 4.51% yield collected annually while waiting for the price thesis to materialise. This is not immaterial. An investor entering at $84.50 and holding for 12 months at a constant price would still collect approximately $3.80 in distributions - enough to buffer a modest price decline and provide meaningful total return even in a sideways rate scenario. The income component is the patience premium, and at a level 250–300 basis points above the S&P 500's dividend yield, it is substantial.
No analysis of TLT is complete without an honest assessment of the supply and demand forces that have kept it rangebound and prevented a clean breakout. These are not negligible tail risks - they are structural headwinds that have been visible in the data throughout 2024 and persist into 2025. The thesis is not that these risks disappear, but that the entry level prices them in sufficiently.
The three scenarios below model TLT's expected price range over a 9–12 month horizon from a scenario entry at $84.50, incorporating both the price mechanics of duration and the income collected from monthly distributions. They are not forecasts - they are scenario analyses designed to frame the asymmetry of the setup.
Rather than attaching specific price triggers to a calendar, the catalyst framework below identifies the sequential conditions that would need to materialise for the base and bull scenarios to activate. Watch these markers in order - they form a logical progression from current uncertainty to thesis confirmation.
Monthly CPI prints confirm tariff inflation is a one-time shock, not structural. Core PCE drops toward 2.5%.
Retail sales, consumer confidence, or jobs data deteriorates meaningfully. Recession probability crosses 50%.
Fed Chair signals readiness to cut. Dot plot shifts. First 25bps cut is delivered or clearly telegraphed.
20-year yield drops meaningfully from entry levels. TLT breaks above $88–$90 resistance with volume.
TLT approaches $93–$96 base-case zone. Assess extension to bull scenario or partial realisation of gains.
The following scenarios reflect the author’s personal analysis and are not investment recommendations. Past performance is not indicative of future results. See our full disclaimer.
iShares 20+ Year Treasury Bond BuyWrite Strategy ETF - The Income Variant
For investors who prioritise yield over capital appreciation - a different way to access the same rate thesis
For investors who found the TLT thesis compelling but whose primary objective is income generation rather than capital appreciation, there is a related instrument that applies a covered-call overlay to the same underlying bond exposure: the iShares 20+ Year Treasury Bond BuyWrite Strategy ETF, ticker TLTW.
TLTW holds the same portfolio of 20+ year U.S. Treasury bonds that TLT does - providing identical exposure to long-duration rate movements - but adds a systematic covered-call strategy on top of that portfolio. Each month, the fund sells at-the-money (or near at-the-money) call options on TLT, collecting option premium and distributing it to shareholders alongside the coupon income from the underlying bonds. The result is a significantly enhanced yield - TLTW has historically distributed 14–20% annually since its 2022 inception, depending on the implied volatility environment, versus TLT's 4.5%. Investors should note, however, that a portion of any distribution may represent return of their own principal rather than new income generated: covered call overlays in a falling price environment can produce high nominal yields that are partly return-of-capital, eroding NAV rather than representing true income. The attractive headline yield is most meaningful when TLT's underlying NAV is stable or rising. In a declining bond price environment, the distribution partially offsets NAV erosion rather than representing pure income. For a holding period thesis like this one, where we expect TLT's price to appreciate, TLTW's total return (distribution plus price appreciation) is the right metric to track, not the yield in isolation.
The critical trade-off is upside participation. In a scenario where TLT rallies sharply - say, 15–20% from a hard landing recession and aggressive Fed cuts - TLTW would participate in that rally only up to the monthly call strike. Any gain beyond that strike is surrendered to the counterparty who bought the calls. In practice, this means TLTW will consistently underperform TLT in strong bull-market scenarios for bonds, while outperforming on a total-return basis in flat or mildly-declining rate environments where the option premium dominates.
TLTW also benefits from elevated implied volatility in the bond market. When market uncertainty is high - as it is throughout 2025, given the tariff and recession dynamics described above - option premiums are richer, and TLTW's monthly covered-call income correspondingly increases. The same macro environment that creates the case for TLT's directional move also inflates the option premium that TLTW distributes.
Disclaimer: This market tip is published by PolyMarkets Research Team for educational and informational purposes only. It does not constitute financial advice, a solicitation, or a recommendation to buy or sell any securities. ETF and bond investments involve risk, including possible loss of principal. Past performance is not indicative of future results. Distribution amounts may vary and are not guaranteed. Interest rate forecasts are inherently uncertain and actual rate movements may differ materially from the scenarios described. Always conduct your own due diligence and consult a licensed financial advisor before making any investment decisions.