Gold and silver markets experienced extraordinary volatility as unprecedented Federal Reserve developments triggered safe haven asset flows. Gold reached $4,568 per troy ounce while silver surged 4.54% to $83.58, reflecting heightened institutional demand amid central bank independence concerns and geopolitical uncertainty.
The speed and scale of the rally raises a question that matters more than the price targets themselves: is this move telling us something structural about precious metals' role in portfolios, or is it an event-driven spike that will fade with the headlines? The evidence suggests the former. Precious metals were already in an institutional re-rating cycle well before the Federal Reserve crisis emerged - the crisis simply compressed into days a re-pricing that the underlying fundamentals had been building toward for months. When safe haven demand lands on top of a market already tightened by structural supply deficits and sovereign buying programs, the upward impulse becomes self-reinforcing in ways that pure crisis moves rarely are.
Federal Reserve Crisis Triggers Precious Metals Surge
Gold markets established new all-time highs of $4,563.61 per ounce following revelations that federal prosecutors opened criminal investigations into Federal Reserve operations. The precious metal advanced more than 1% as spot prices reached their first record high of the year, propelled by safe-haven demand following unprecedented institutional developments.
Federal Reserve Chairman Jerome Powell disclosed that the U.S. Department of Justice issued subpoenas to the Federal Reserve and threatened criminal indictment related to testimony before the Senate Banking Committee concerning facility renovation expenditures. The investigation centers on testimony regarding a $2.5 billion renovation of the Federal Reserve's Washington headquarters delivered during June hearings.
In public statements, Powell characterized the investigation as stemming from ongoing conflicts with administration officials over monetary policy independence. The threat of criminal charges appears connected to Federal Reserve determinations regarding interest rates based on institutional judgment rather than political preferences, according to Powell's video announcement.
The World Gold Council has consistently noted that gold's most powerful demand surges occur not when inflation rises modestly, but when investors begin to question the institutional reliability of the monetary framework itself. Threats to central bank independence - whether perceived or real - sit at the top of that category, because they introduce uncertainty about the long-run anchor for fiat currency values. The events surrounding the Federal Reserve investigation fit that pattern precisely.
Silver markets demonstrated even stronger performance, rocketing 4.54% to $83.58 per troy ounce. The white metal's extraordinary rally has produced 181.78% gains over the trailing twelve-month period, reflecting both safe haven demand and robust industrial consumption fundamentals.
Retail trading firms responded to precious metals volatility through varying operational adjustments. Some brokers increased available leverage on gold positions, while others issued volatility warnings and implemented temporary trading restrictions. These divergent approaches reflect institutional assessments of market conditions and risk management priorities.
Gold Technical Analysis: Price Discovery Phase
Gold entered a price discovery phase following the breach of previous all-time highs. However, daily closes above prior resistance levels will provide confirmation that upward momentum remains intact and the precious metal is prepared for continued northward movement.
Technical analysis utilizing Fibonacci extensions reveals potential price targets based on historical retracement patterns. The 100% Fibonacci extension level coincides with the $5,000 threshold, a target referenced by multiple major financial institutions in their analytical frameworks and price forecasts. Goldman Sachs commodity strategists have argued that the $5,000 level represents a confluence of Fibonacci resistance and the upper band of their central bank demand scenario - meaning it is not an arbitrary round number but a level supported by both technical and fundamental frameworks simultaneously.
Key support levels have been established through recent price action. The October peak around $4,360 represents the first major support zone, while the 50-day exponential moving average (50 EMA) currently positioned near $4,255 per ounce provides additional technical support. These levels will serve as important reference points during any corrective price movements.
The 200-day exponential moving average (200 EMA), currently situated at $3,730 per ounce, represents the critical technical level that would signal potential trend reversals. A decline below this threshold would indicate a return to downtrend conditions and suggest stronger correction dynamics ahead. However, current market enthusiasm suggests this scenario remains unlikely in the near term.
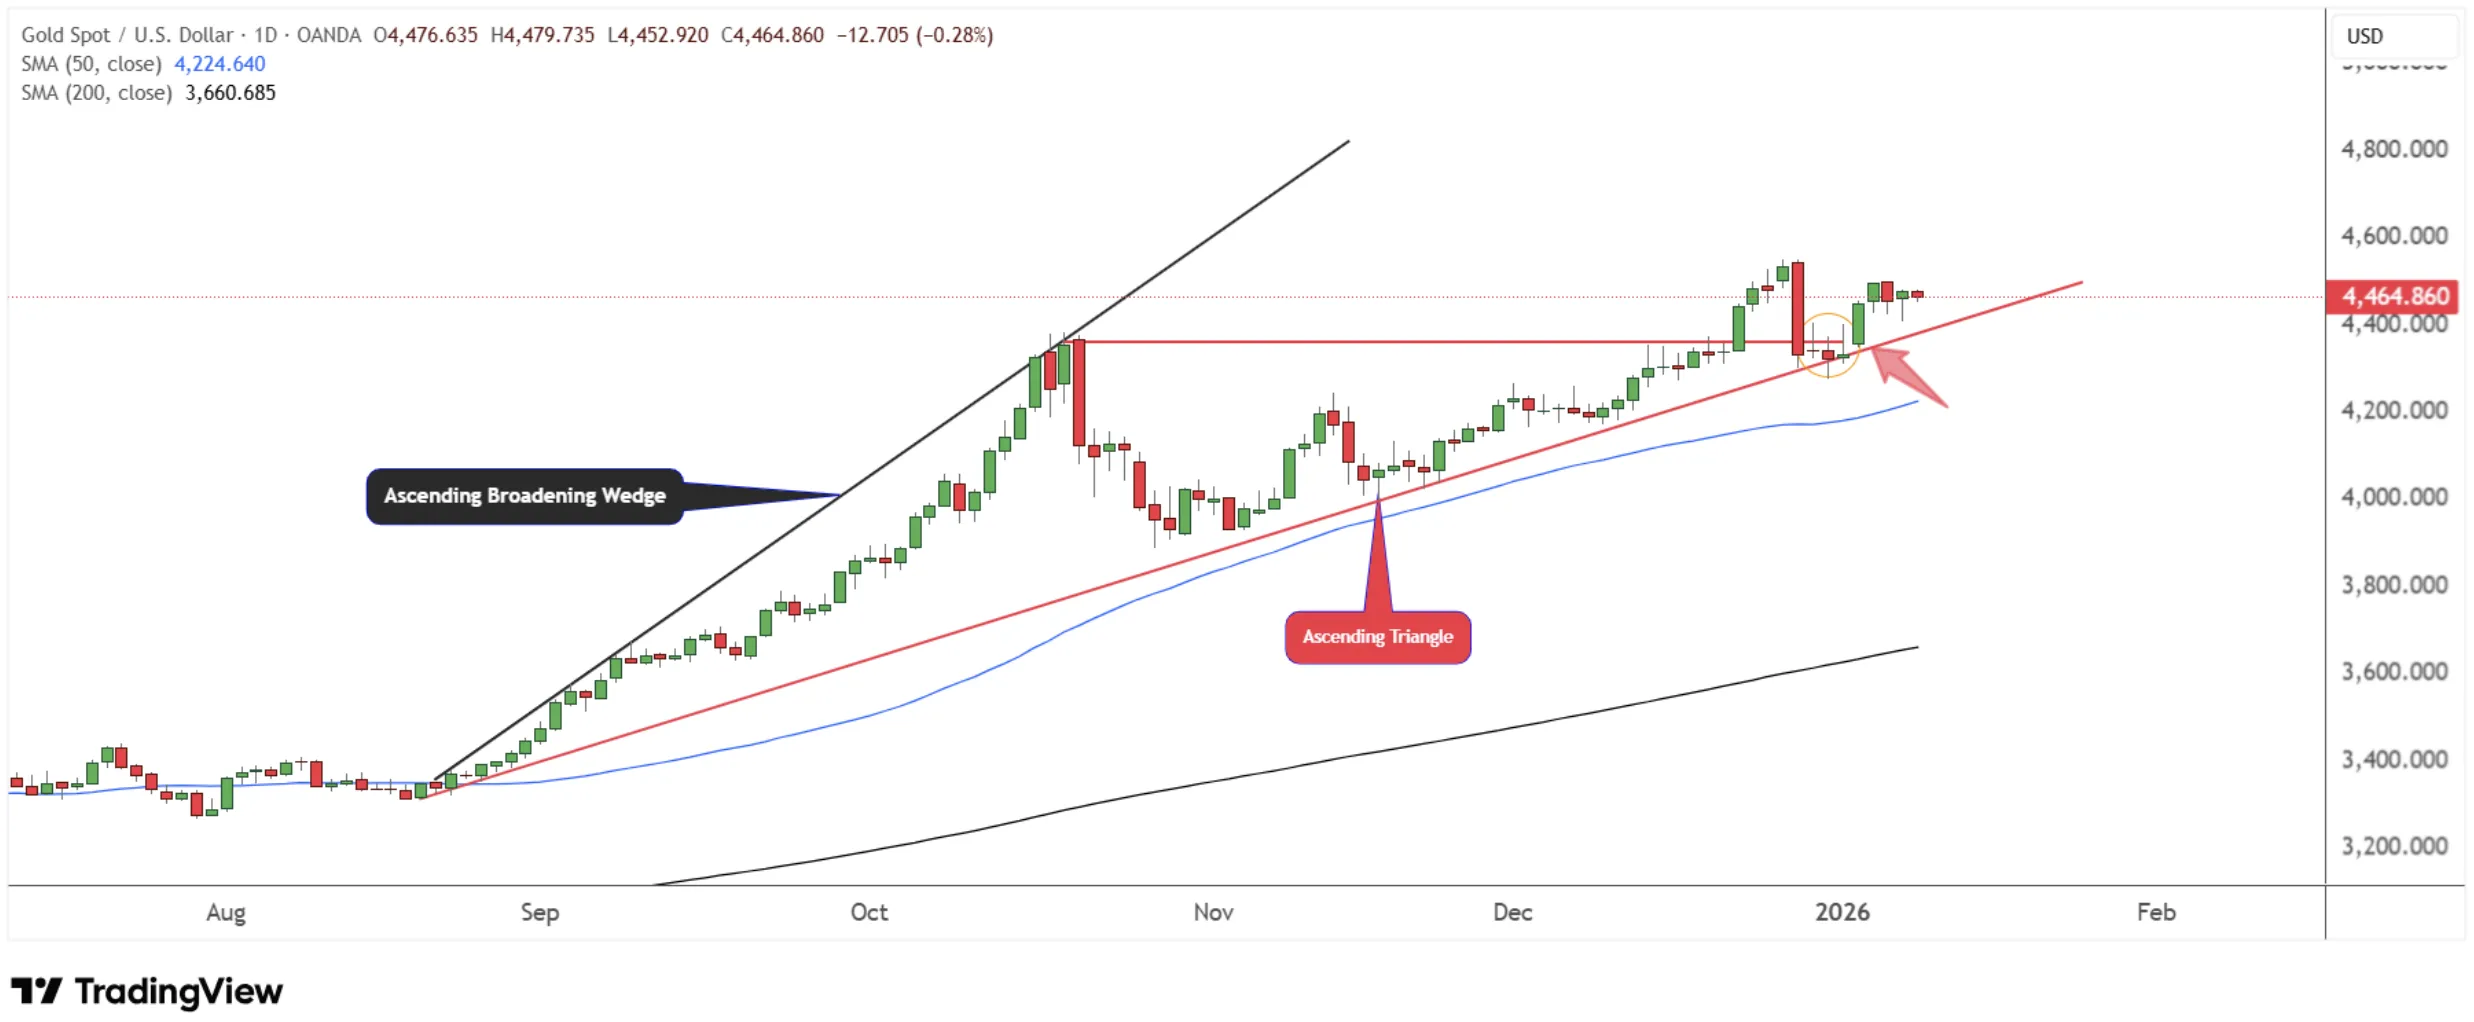
Gold Spot / U.S. Dollar - Daily Chart (TradingView)
The daily chart for spot gold shows short-term price fluctuations above the strong support at the $4,360 level. The price is again approaching $4,360 and a breakout below would indicate further downside toward $4,250. A break below $4,250 would open the door to the $4,000 area. However, if the $4,360 support holds, it would signal a buildup of positive energy for a breakout above $4,550 - and a decisive move above that level would initiate a strong push toward the $5,000 target.
Key Gold Technical Levels
- Current Price: $4,568 (new ATH, price discovery phase)
- Next Target: $5,000 (100% Fibonacci extension)
- Support 1: $4,360 (October 2025 peak)
- Support 2: $4,255 (50-day EMA)
- Critical Support: $3,730 (200-day EMA - bearish invalidation)
- Trend Status: Bullish until break below 200 EMA
Silver Technical Analysis: Outperformance Dynamics
Silver's price chart displays even stronger momentum than gold, gaining over 5% in a single trading session and testing levels above $84 per ounce. These levels slightly exceed the peaks reached on December 29, the same date when gold established its previous highs, demonstrating coordinated precious metals strength.
Fibonacci extension analysis applied to silver's uptrend from April lows through October peaks at $54 per ounce, followed by the subsequent corrective decline, indicated a 100% Fibonacci extension around $72 per ounce. This technical target has already been achieved with significant surplus, validating the analytical framework.
The next significant technical target stands at the 161.8% Fibonacci extension level, positioned several dollars above current price levels around $88 per ounce. Some market analysts maintain considerably more bullish perspectives on silver's potential relative to the U.S. dollar, suggesting targets well beyond this technical level.
A notable technical concern emerges from the substantial distance between current prices and key moving averages. The 50-day EMA resides around $64, while the 200-day EMA sits near $48, illustrating the extraordinary velocity of the recent uptrend. This divergence suggests potential vulnerability to sharp corrective movements should momentum wane.
Silver's 2025 performance demonstrates exceptional strength, gaining 150% over the calendar year. Since the beginning of 2026, silver has advanced an additional 17% - a gain equivalent to the S&P 500's entire 2025 return achieved in merely days. Over the past month, silver prices have risen 30.50%, while the trailing twelve-month performance reaches 181.78%, reflecting both safe haven demand and robust industrial fundamentals.
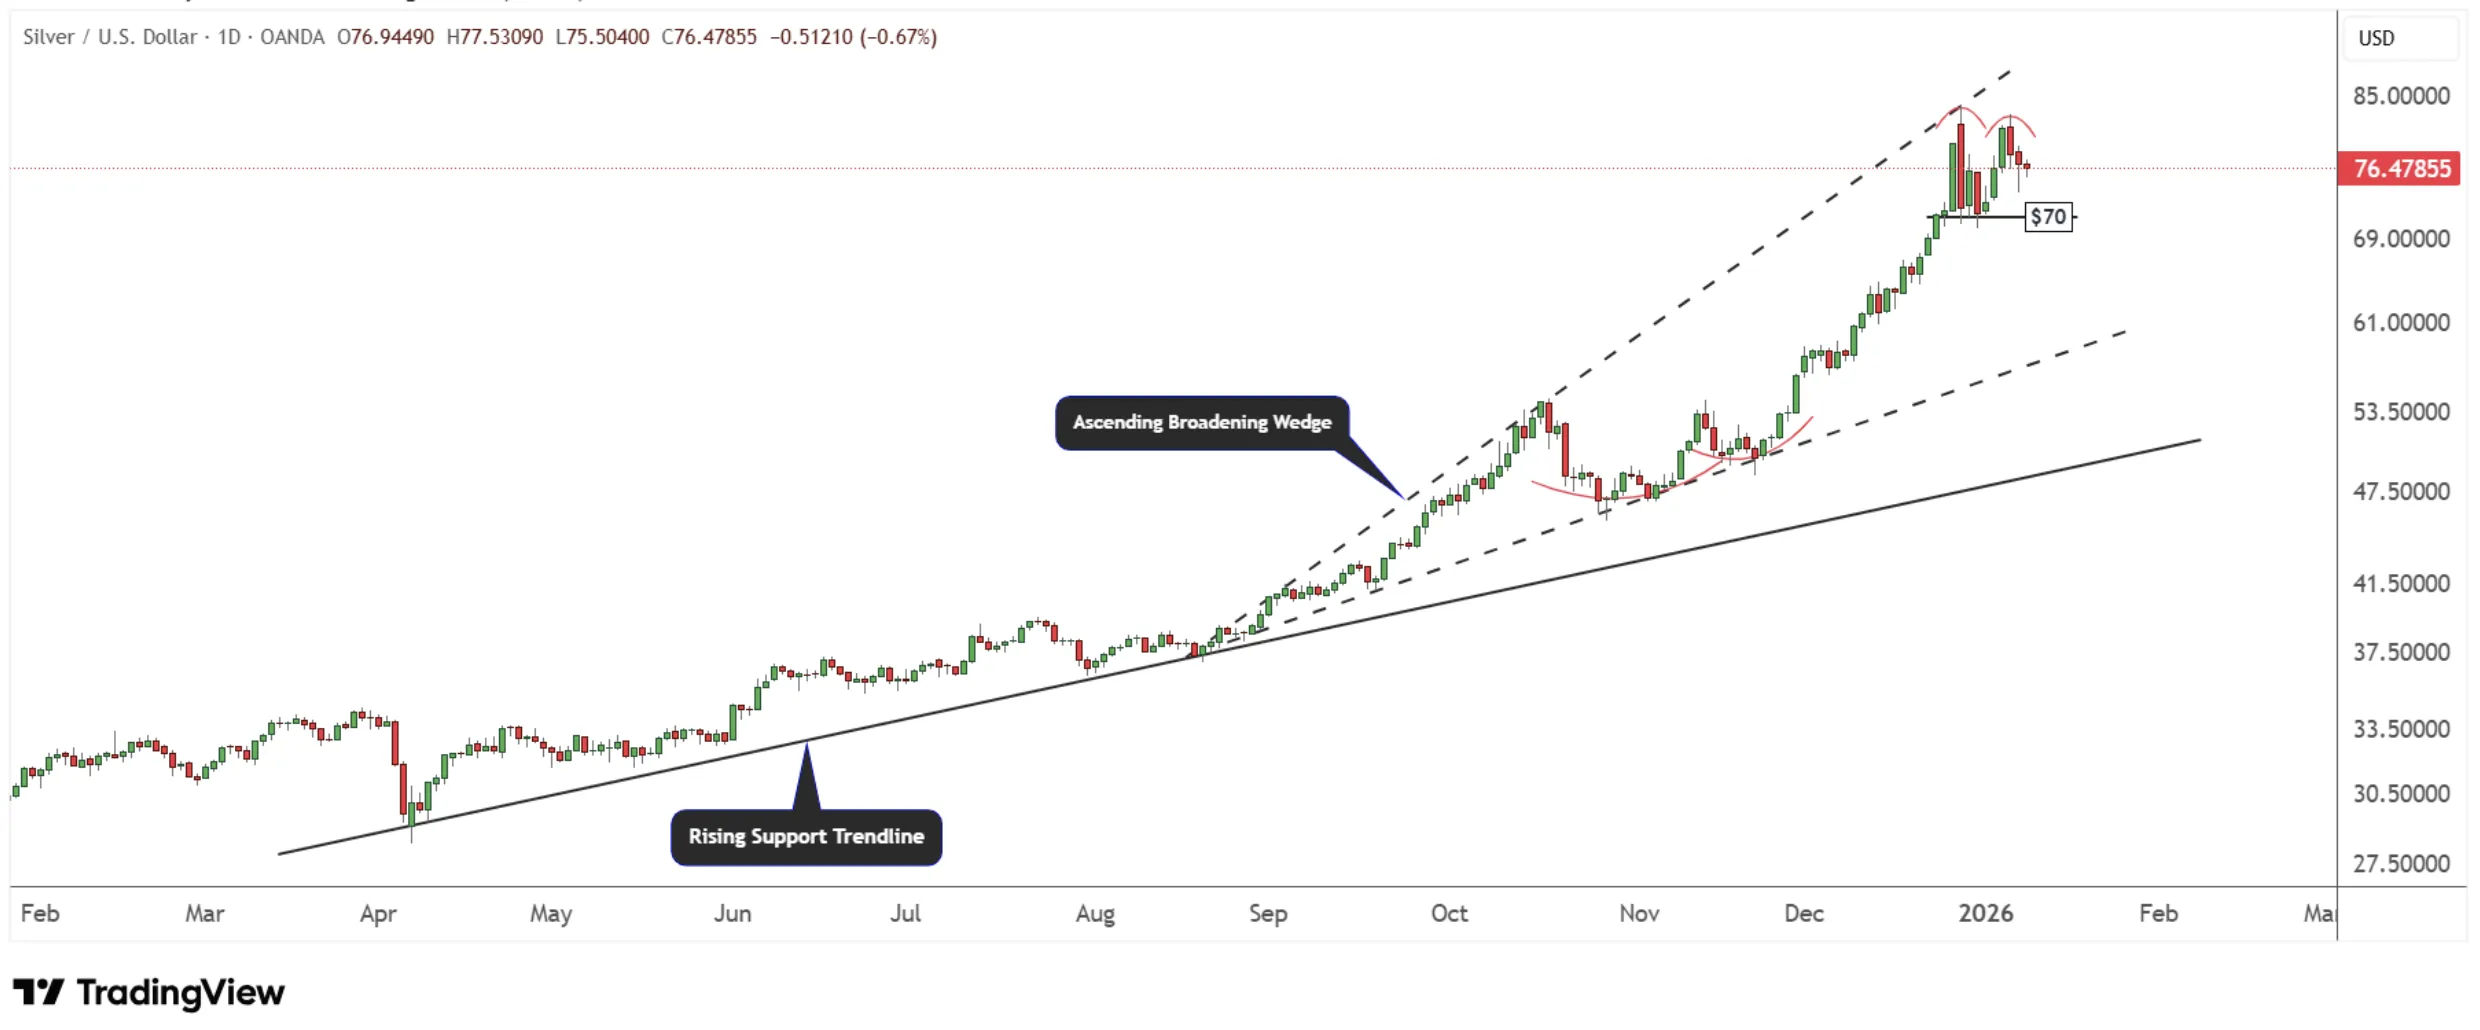
Silver / U.S. Dollar - Daily Chart (TradingView)
The daily chart for spot silver (XAG) reveals the buildup of a topping pattern at the $84 area, as the price appears exhausted in the short term. A double top pattern is forming with a neckline at the $70 area. A break below $70 would confirm the pattern and indicate further downside toward the $60–$65 support zone. As long as $60 holds, the next major move in silver will likely be higher - targeting the $100 area. A break below $60 would take silver prices toward the rising trendline around $50, which serves as long-term support for 2026.
Key Silver Technical Levels
- Current Price: $83.58 (exceeding December 29 highs)
- Next Target: $88 (161.8% Fibonacci extension)
- Previous Target: $72 (100% Fibonacci - exceeded)
- Support 1: $64 (50-day EMA - significantly below)
- Support 2: $48 (200-day EMA - shows trend strength)
- 2025 Performance: +150%
- 2026 YTD: +17% (matches S&P 500's entire 2025 gain)
- Warning: Large distance from moving averages suggests overextension risk
The Industrial Demand Squeeze
With a raging AI infrastructure boom and the ongoing electrification of practically everything, industrial demand for silver is red-hot. This is what makes the current bull market fundamentally different from the previous peaks of March 1980 and April 2011. Even if the COMEX raises margin requirements to keep a lid on prices, the effect will be temporary at best, because the core buyers are industrial in nature. They are hungry for the metal not to speculate, but to manufacture real-world goods - solar panels, batteries, and AI GPUs.
The recent off-take agreement between Samsung and Silver Storm (SVRS:CA) to restart the La Parrilla silver mine in Mexico is a perfect case in point. The $7.0 million deal is small in the grand scheme of things, but it sends a strong symbolic message: end-users are now reaching upstream to secure physical supply.
In a sense, the AI infrastructure boom merely broke the camel's back. Industrial demand was rising rapidly well before OpenAI released ChatGPT in November 2022. If AI data centres are among the most electricity-hungry facilities on Earth, should we be surprised that they also have a tremendous appetite for the element with the best electrical conductivity on the periodic table?
In the midst of rising geopolitical tensions between the United States and China, developments surrounding artificial intelligence have become a matter of national security. The strategic importance of AI may be one of the core reasons why the U.S. Geological Survey added silver to its critical minerals list in November 2025.
According to the 2025 World Silver Survey, industrial demand now accounts for almost 60% of global demand, up from approximately 50% a decade ago. Given the structural demand growth from photovoltaics, electric vehicles, and AI applications, industrial demand could increase to more than 70% of global demand sometime in the 2030s. This is a critical distinction: metal flowing into the industrial channel is ultimately consumed - not stored in vaults, as is the case with monetary demand. The Silver Institute has highlighted that this consumption-versus-storage distinction makes silver's supply dynamics structurally tighter than gold's - because industrial silver cannot be easily recycled back into tradeable bullion form at scale, effective above-ground availability shrinks faster than headline production and stockpile data suggest.
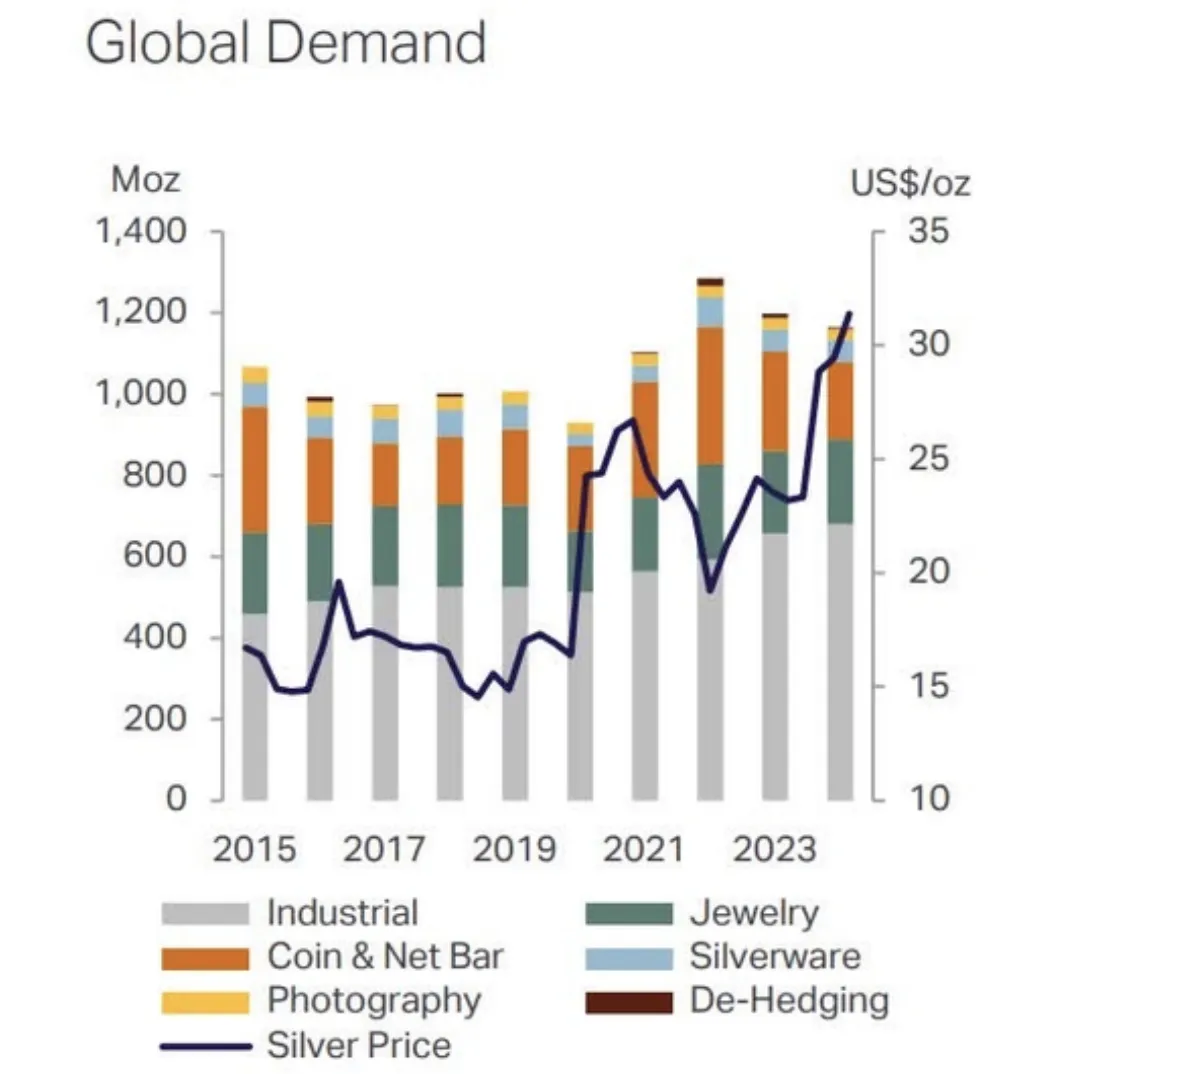
Global Silver Demand (Metals Focus, Bloomberg)
Automotive Silver Demand: The EV Transition
The electrification of the automotive industry is clearly supportive of silver demand, though there are important caveats. The upper and lower bands of silver consumption by powertrain type are wide, meaning global demand estimates could be skewed in either direction. As the number of electronic functions per vehicle increases - and the move towards autonomous driving boosts the need for sensors and ECUs - silver loading per vehicle is likely to rise over time. On the other hand, efforts to consolidate multiple ECUs into single domain control units could dampen demand at the margin. On balance, the transition to EVs is expected to boost silver consumption, particularly through the increasing use of electrical and electronic components.
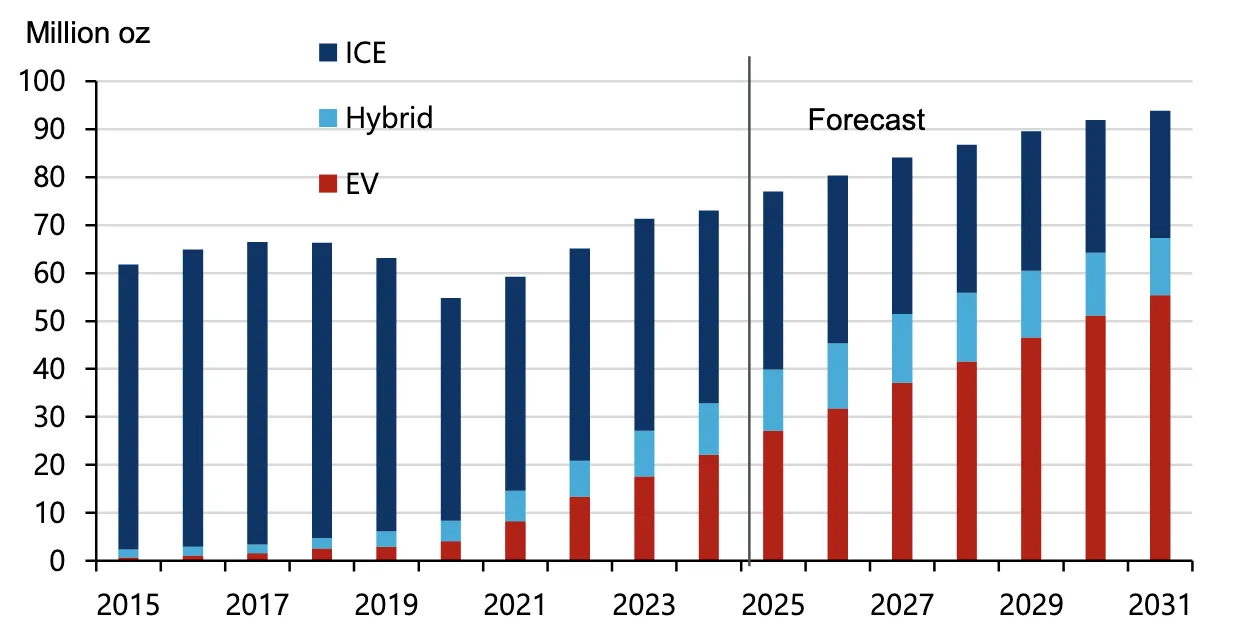
Silver Demand by Automotive Powertrain - ICE, Hybrid, and EV (2015–2031 Forecast)
Solid-State Batteries: A Potential Game-Changer
Another potential catalyst for silver's industrial demand is the development of solid-state batteries for electric vehicles. Samsung is at the leading edge with a technology promising a 600-mile range, 9-minute charging, and 20-year lifespan, using a silver-carbon anode. Toyota is developing a similar technology, also targeting over 600 miles on a single charge. Though mass commercialisation has not yet arrived, this could be a game-changer not only for the EV industry but also for silver demand.
According to various estimates, next-generation solid-state batteries could require up to 1 kilogram of silver for every 100 kWh vehicle battery pack. With 17.3 million electric cars produced globally in 2024, even a modest 10% penetration rate would mean 1.7 million solid-state batteries consuming approximately 55 million ounces of silver - roughly 5% of total global demand. Mass adoption remains in the future, but the potential impact on industrial demand through the 2030s is significant.
Data Centres & AI: The Silver-Hungry Infrastructure Boom
The surge in data consumption and adoption of AI technologies has driven a rapid increase in data centre construction globally. The number of data centres worldwide has grown elevenfold since 2000, with over 4,600 facilities operating today.
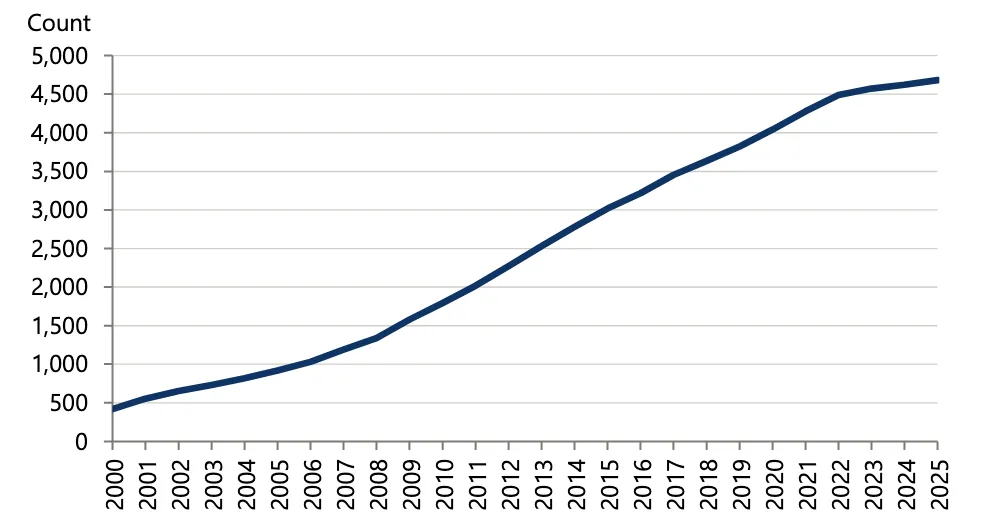
Global Stock of Data Centres, 2000–2025
However, a simple count of facilities does not capture the full scale of expansion. While the number of data centres grew 11x since 2000, total global IT power capacity - the computing capacity of servers, storage, and networking devices - grew an estimated 53x, from 0.93 GW to nearly 50 GW in 2025. This exponential rise reflects a shift towards fewer but significantly larger and more powerful facilities, each containing more servers, switches, and cooling systems that require silver in their core components.
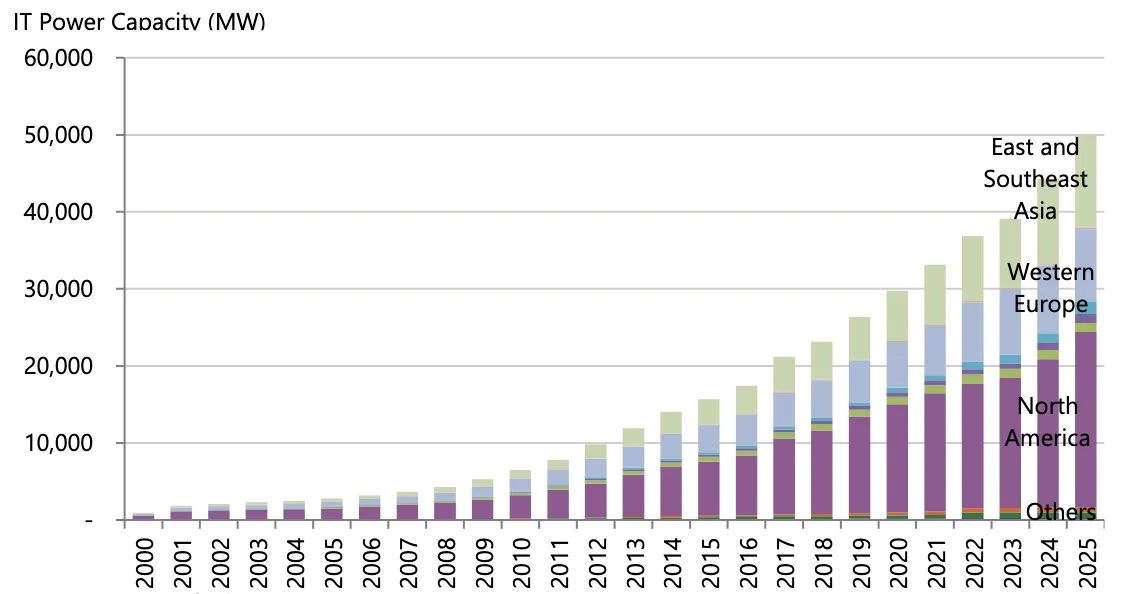
IT Power Capacity by Region, 2000–2025 (MW)
Data centre computing capacity is currently concentrated in three regions: North America, Western Europe, and East and Southeast Asia account for 88% of global computing capacity. As demand for digital services expands to Latin America, South Asia, and Africa, data centre construction - and silver demand - will follow. While AI model training can be performed remotely, latency-sensitive applications such as real-time cloud services, high-frequency trading, and search engines require proximity to end users, driving geographic expansion.
The United States alone accounts for over 22.57 GW of estimated IT power capacity. Looking ahead, data centre construction in the U.S. is forecast to grow by 57% over the next decade, providing a clear benchmark for expansion in other established markets.
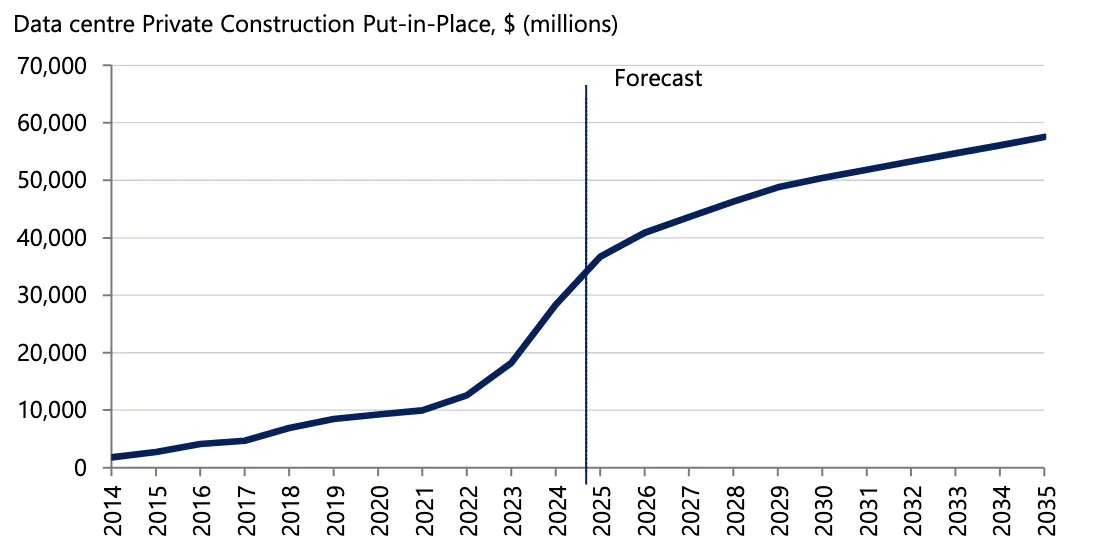
U.S. Data Centre Private Construction Put-in-Place, 2014–2035 Forecast ($ millions)
Beyond data centres themselves, the rise of artificial intelligence is expected to boost silver demand across the broader hardware ecosystem. AI applications increasingly rely on specialised hardware - GPUs, TPUs, and NPUs - all of which depend on high-performance semiconductors that use silver in their internal connections and packaging. Additionally, the electronics supporting AI integration, from autonomous vehicles and robotics to edge computing devices, require silver-rich components such as fuses, switches, and sensors.
Industrial demand for silver reached a record high in 2024 at 680.5 million ounces, underpinned by record electronics and electrical demand driven by AI-related applications in consumer electronics and hardware.
Monetary Demand Adding Fuel to the Fire
In the commodity and precious metals space, silver is unique due to its dual nature as both an industrial and monetary metal. Unlike copper (a pure industrial metal) or gold (a pure monetary metal), silver is exposed to both demand drivers - and the monetary side of the equation looks as bright as, or even brighter than, the industrial picture.
JPMorgan's precious metals desk has highlighted that gold's relationship with real interest rates - historically its most reliable valuation anchor - has structurally weakened since 2022, with gold maintaining elevated prices even as real rates climbed sharply. This decoupling, JPMorgan argues, reflects a new demand regime driven by central bank accumulation that is less sensitive to rate movements than the investment demand that dominated the prior decade. The implication is that any further Fed rate cuts amplify a rally that is already underway for independent structural reasons - rather than being the primary cause.
Monetary demand is notoriously difficult to track, but according to the Silver Institute, demand for silver bars and coins amounted to approximately 200 million ounces in 2024. Including net investment demand for exchange-traded products such as the iShares Silver Trust (SLV), the Sprott Physical Silver Trust (PSLV), and the abrdn Physical Silver ETF (SIVR), monetary demand for 2024 increases to approximately 250 million ounces. These figures from the Silver Institute should be treated as rough guides rather than precise measurements.
Monetary demand for silver can be notoriously volatile, but considering the current macro environment, it is reasonable to expect continued growth in the coming years. The U.S. national debt now stands at $38.4 trillion - an increase of more than $2.0 trillion in 2025 alone, a relatively benign year without any significant calamity like a recession, a war, or a pandemic. At the current pace, the U.S. national debt is expected to reach $40.0 trillion sometime in 2026. The question increasingly on investors' minds: how long before a crisis of confidence occurs in the Treasury market?
Expert Gold Price Predictions: $5,000-$6,000 Targets
Major financial institutions and expert analysts have released updated gold price forecasts for 2026, with most predictions clustering around the $5,000 level identified through Fibonacci analysis. These institutional forecasts reflect growing consensus regarding sustained precious metals strength driven by multiple fundamental factors.
Realistic Scenario: $5,000 Per Ounce
Professional traders and market analysts identify $5,000 per ounce as a realistic near-term target for gold prices. This perspective incorporates continued central bank accumulation, Federal Reserve monetary policy evolution, and sustained individual investor participation in precious metals markets.
Market observers note that major banking institutions have maintained relatively modest forecasts thus far, with Goldman Sachs and other large institutions discussing $5,000 targets. However, some analysts suggest these recommendations may be revised higher as market dynamics evolve and fundamental support factors strengthen.
Extreme Scenario: $6,000+ Per Ounce
The most aggressive forecasts relate to potential geopolitical escalation scenarios involving territorial disputes. Under such circumstances, $6,000 would represent the absolute minimum price target, reflecting a fundamental reshuffling of international policy frameworks that have functioned since the 1940s.
The scenario envisions potential military action regarding territorial acquisitions from NATO allies. Such developments would constitute attacks on allied states that are both NATO and European Union members, potentially triggering alliance fractures and institutional crises.
Strategic territories hold significance on missile routes between major powers, contain substantial rare earth metal deposits, and control year-round trade corridors maintained through specialized infrastructure. These factors contribute to elevated geopolitical risk assessments.
Market analysts note that coercive territorial acquisition attempts - whether through financial inducements or military pressure - represent situations that would substantially elevate gold prices. Such scenarios would constitute fundamental disruptions to established international order, driving substantial safe haven demand.
Major Bank Gold Forecasts
| Institution | 2026 Gold Forecast | Key Assumptions |
|---|---|---|
| Goldman Sachs | $4,900/oz (year-end) | Central bank buying, Fed cuts |
| JP Morgan Private Bank | $5,055/oz (Q4 average) | Institutional demand 566 tons/quarter |
| JP Morgan Private Bank | $5,200-$5,300/oz (potential peak) | Strong safe haven flows |
| Deutsche Bank | $4,450/oz (annual average) | Reserve diversification, range $3,950-$4,950 |
| Bank of America | $4,538/oz (annual average) | Continuation of 2025 trends |
Goldman Sachs projects gold will reach approximately $4,900 per ounce by year-end 2026, supported by continued central bank purchases and Federal Reserve rate adjustments. JP Morgan Private Bank analysts maintain more optimistic perspectives, forecasting an average price of $5,055 in fourth quarter 2026, with potential peaks reaching $5,200-$5,300 per ounce.
Deutsche Bank raised its average 2026 gold price forecast from $4,000 to $4,450 per ounce, citing continued diversification of central bank reserves and stabilizing investor demand. Bank of America estimates the average 2026 gold price at $4,538 per ounce, assuming central bank and investor purchases averaging approximately 566 tons quarterly.
Silver Price Predictions: $200-$500 Long-Term Targets
Prominent financial authors have issued vocal predictions regarding silver's potential, releasing a series of forecasts as the metal approached $80 in late December. These predictions suggest substantial upside potential beyond current technical targets, though they represent aggressive scenarios rather than consensus forecasts.
As silver approached $80 on December 29, social media commentary suggested $200 as the next significant milestone. This bold prediction preceded a brief correction that validated earlier cautions regarding potential pullbacks, though prices quickly recovered to new highs.
Two days prior, on December 28, warnings emerged regarding "FOMO Fear of Missing Out MANIA" with advice advocating patience. Recommendations suggested that investors planning silver allocations should wait for corrections before establishing positions - advice that proved prescient as a subsequent pullback from $83 to $70 materialized before rapid recovery.
Previous predictions suggested silver could reach $500 from $100 levels within a year, representing a 5x return for investors positioned correctly. These forecasts assume continued monetary accommodation and industrial demand acceleration beyond current projections.
Expert Silver Outlook
Market analysts suggest silver may appreciate more than gold during 2026, particularly since growth parity hasn't been filled and governments haven't stockpiled silver with the same intensity applied to gold accumulation programs. This creates significant catch-up potential relative to gold price movements.
Addressing concerns about market manipulation following exchange margin requirement increases, analysts note that reductions from $83 peaks to $70 prompted declarations that the silver bull market had ended. However, if prices rise 60% then correct 15%, the net result remains a positive 45% gain - hardly indicative of market collapse.
Manipulation attempts on American exchanges through raised collateral requirements failed to trigger sustained market declines. The correction proved brief, with silver quickly recovering to establish new highs, suggesting underlying demand fundamentals remain robust despite temporary volatility.
A Generational Bull Market in Silver
It is our view that silver is currently in the midst of a generational bull market underpinned by structural industrial demand growth. The ongoing AI infrastructure boom only adds pressure to an already tight market and acts as a catalyst that unveils the precarious physical reality behind the paper illusion of abundance. For the first time in decades, the physical reality is in the driver's seat - and the dynamics in the silver market could escalate very quickly from here. This thesis is well supported by the positive evolution in analyst sentiment.
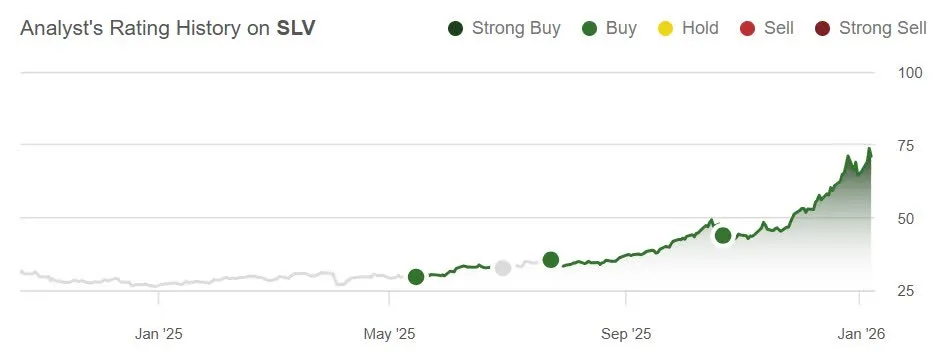
Analyst's Rating History on SLV (iShares Silver Trust)
At least in the short term, an increasing amount of metal will have to come out of above-ground stockpiles. In contrast to gold, the above-ground reserves of silver are much smaller relative to annual production. Silver is increasingly consumed in industrial processes, so there is a limit to how much metal can be released from stockpiles. Moreover, the silver market has been in a supply deficit for several years already, meaning a portion of the readily available metal has been exhausted. Sprott Asset Management has argued that consecutive years of supply deficits in silver - a metal where industrial end-users cannot easily substitute alternatives - create a qualitatively different price environment from cyclical commodity tightness, because the buyers absorbing deficit volumes are largely price-insensitive manufacturers rather than speculative traders who would exit on a pullback.
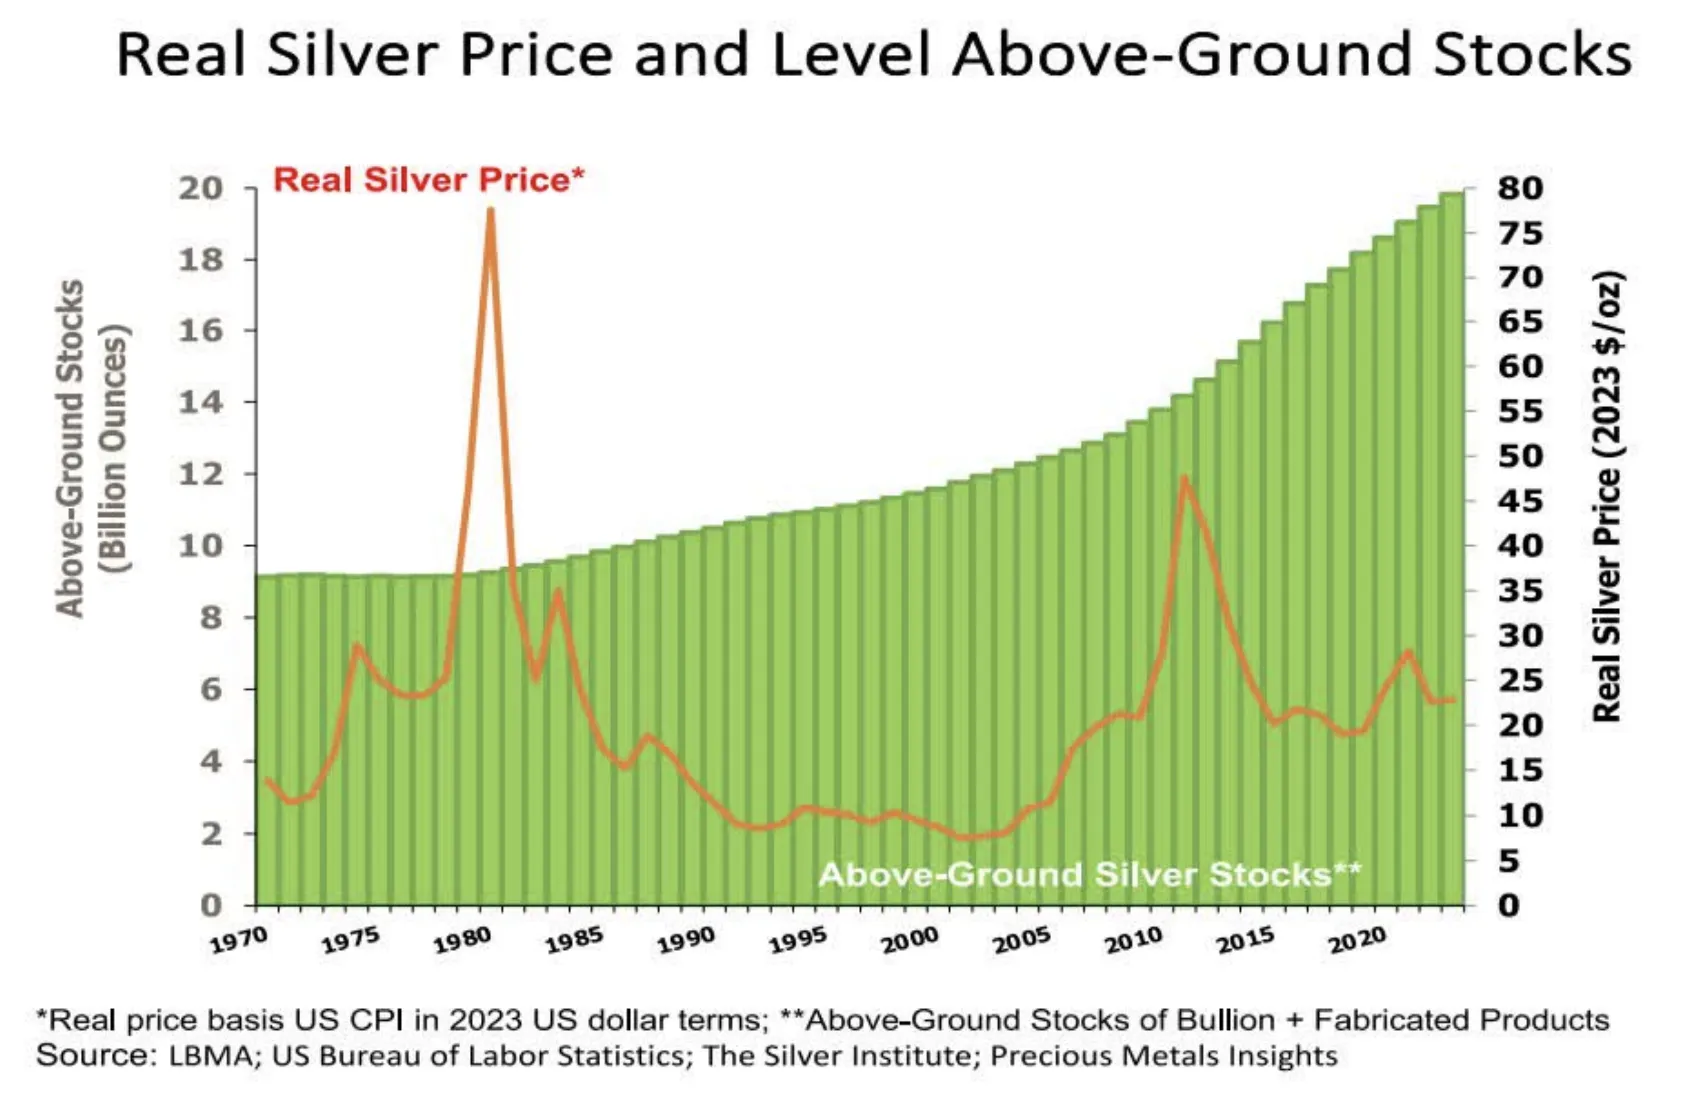
Real Silver Price and Above-Ground Stocks (IRMA, Silver Institute, Precious Metals Insights)
Even with silver prices up more than 150% over the past twelve months, we believe we are still in the early phase of a generational bull market. The rapidly increasing industrial demand is putting growing pressure on paper market structures, meaning that for the first time in decades, it is the physical metal that is actually driving this market higher.
Key Takeaways
- Gold reached all-time highs of $4,568 amid Federal Reserve independence crisis and criminal investigation developments
- Silver outperformed with 4.54% gains to $83.58, extending twelve-month returns to 181.78%
- Technical analysis identifies $5,000 as gold's next major target (100% Fibonacci extension) with support at $4,360 and $4,255
- Silver targets $88 (161.8% Fibonacci extension) after achieving 150% gains in 2025 and 17% year-to-date in 2026
- Institutional forecasts cluster around $4,900-$5,300 for gold, with extreme scenarios suggesting $6,000+ under geopolitical stress
- Long-term silver predictions range from $200 to $500, though these represent aggressive scenarios beyond consensus estimates
- Distance between current prices and moving averages suggests potential vulnerability to corrections despite strong momentum
- Retail brokers responded with varied approaches including leverage adjustments and volatility warnings
- Industrial demand now accounts for ~60% of global silver demand, driven by AI, solar, and EV applications
- Solid-state batteries could add ~55 million ounces of silver demand at just 10% EV adoption
- Silver market has been in a supply deficit for several years, with above-ground stockpiles declining
PolyMarkets Investment Strategies, Market Research, January 10, 2026