Financial markets, much like the seasons or the ocean tides, move in cycles. These recurring periods of expansion and contraction, of optimism and pessimism, are not anomalies to be feared - they are fundamental patterns to be understood. While no two cycles are identical in duration or magnitude, they are driven by a remarkably predictable interplay of economics, institutional behaviour, and, most critically, human psychology.
Here is the central paradox every investor must internalise: the stock market is not a barometer of the present. It is a forecasting machine. It prices the future, not the present. And because most investors react to present conditions - buying when headlines are good, selling when headlines are dire - they are perpetually acting on information the market has already digested and moved past. The result is a predictable, avoidable, and entirely human tragedy: buying high and selling low.
This course does not teach you to predict the market's next move - that is a fool's errand, and the evidence against market timing is overwhelming. What it does teach is orientation: how to know where you are in the cycle, what forces are at work, how to manage your own psychology, and how to act rationally and strategically regardless of the market's prevailing mood. That discipline, practised consistently, is the actual edge that separates long-term wealth builders from the crowd.
This course covers market cycles vs economic cycles, bull and bear definitions, the four-stage Wyckoff model, stage-by-stage deep dives, the 14-phase psychology of the cycle, six cognitive biases with antidotes, the evidence against market timing, and a practical framework for cycle-aware investing.
Market Cycles vs. Economic Cycles
The most important distinction in macro investing is one most beginners never learn: the stock market and the economy are not the same thing. Understanding the lead-lag relationship between them unlocks a framework that explains most of the timing errors individual investors make.
An economic cycle - also called a business cycle - refers to the natural fluctuation of the economy between periods of expansion and contraction. It is measured by GDP growth, employment, industrial production, and corporate profits. These numbers are real-world indicators of what the economy is doing right now.
A market cycle, by contrast, refers to the trends and patterns in financial asset prices. Its peaks and troughs are measured not by GDP but by the price levels of securities - the S&P 500, bond yields, commodity prices. And here is the critical fact: the stock market historically peaks and begins to decline 6 to 12 months before a recession officially starts, and it bottoms and begins recovering before the economy shows clear signs of improvement.
This lead-lag relationship is not a coincidence. It is a fundamental feature of how markets work. Financial markets function as a forward-looking discounting mechanism - stock prices reflect the market's collective expectation of future corporate profits, not current ones. Since corporate profits are tied to the future health of the economy, the stock market is essentially a massive, sentiment-driven wager on where the economy will be in the next two to four quarters.
| Dimension | Economic Cycle | Market Cycle |
|---|---|---|
| What it measures | Real economic activity - GDP, employment, output | Financial asset prices - stocks, bonds, commodities |
| Lead/Lag | Lags - confirms what has already happened | Leads - anticipates by 6–12 months |
| Key indicators | GDP growth, unemployment rate, industrial production | S&P 500 price level, VIX, yield curve, credit spreads |
| Common investor error | Waiting for economic confirmation before investing | Treating current prices as reflections of current conditions |
| Investment implication | By the time a recession is confirmed, the market may already be recovering | Act on where the cycle is going, not where it currently is |
This structural timing mismatch is the single biggest reason why average investors consistently underperform passive index funds over the long run. They use the wrong clock. The Morningstar "Mind the Gap" study, published annually, documents this precisely: the gap between the returns a fund delivers and the returns the average investor in that fund actually receives is almost entirely attributable to poor timing - buying after strong performance and selling after poor performance, in exact opposition to what the cycle demands.
Bull vs. Bear, Secular vs. Cyclical
Before you can navigate market cycles, you need precision in the language. Imprecise terminology leads to imprecise thinking - and imprecise thinking is expensive when capital is at stake.
The most fundamental terms are bull and bear markets. A bull market is technically defined as a rise of 20% or more from a recent low. A bear market is the reverse: a decline of 20% or more from a recent peak. Both definitions are widely used by professionals and financial media.
Historical data reveals a critical asymmetry between the two: bull markets have been significantly larger and longer-lasting than bear markets. The average U.S. bull market lasts approximately 4.5 years with an average gain of 152%. The average bear market lasts approximately 9.5 months with an average decline of 36%. This asymmetry is the fundamental reason that time in the market - remaining invested through the full cycle - consistently beats attempting to time the exits and re-entries. The cost of missing even a handful of the best days, which tend to cluster at the beginning of recoveries when sentiment is still worst, is devastating to long-term compounding.
| Term | Definition | Typical Duration | Driven By | Investor Action |
|---|---|---|---|---|
| Bull Market | +20% rise from a recent low | Avg. ~4.5 years | Economic expansion, earnings growth, falling rates | Hold, add on dips; resist trimming too early |
| Bear Market | −20% decline from a recent peak | Avg. ~9.5 months | Recession fears, credit tightening, earnings contraction | Avoid panic selling; accumulate quality on weakness |
| Secular Trend | Multi-decade structural direction | 10–30+ years | Technology, demographics, structural economic shifts | Align long-term bets with secular tailwinds |
| Cyclical Trend | Shorter fluctuation within the secular | Months to several years | Business cycle, monetary policy, earnings cycle | Adjust sector/asset allocation as cycle rotates |
The distinction between secular and cyclical trends is crucial for long-term strategic planning. A secular trend is a decades-long movement driven by powerful structural forces - the shift from physical to digital retail, the rise of artificial intelligence, ageing demographics in developed economies. These forces create sustained tailwinds for specific industries, often operating independently of the shorter-term business cycle. An investor who correctly identifies a secular tailwind and holds patient through cyclical headwinds is rewarded disproportionately over time.
A cyclical trend, by contrast, is tightly tied to the economic cycle. Industries like housing, automobiles, and industrial commodities are highly cyclical - their performance tracks economic growth and consumer spending closely. These trends repeat as the economy cycles through expansion and contraction. Mixing up secular and cyclical signals is one of the most common sources of poor portfolio decisions: selling a secular winner because of a cyclical headwind, or confusing a cyclical bounce in a structurally declining industry for a genuine recovery.
The Four Foundational Stages of a Market Cycle
While every cycle has unique characteristics, most can be understood through a four-stage framework popularised by market analysts including Richard Wyckoff. This model - comprising accumulation, markup, distribution, and markdown - provides a clear roadmap for interpreting price action, trading volume, and investor sentiment.
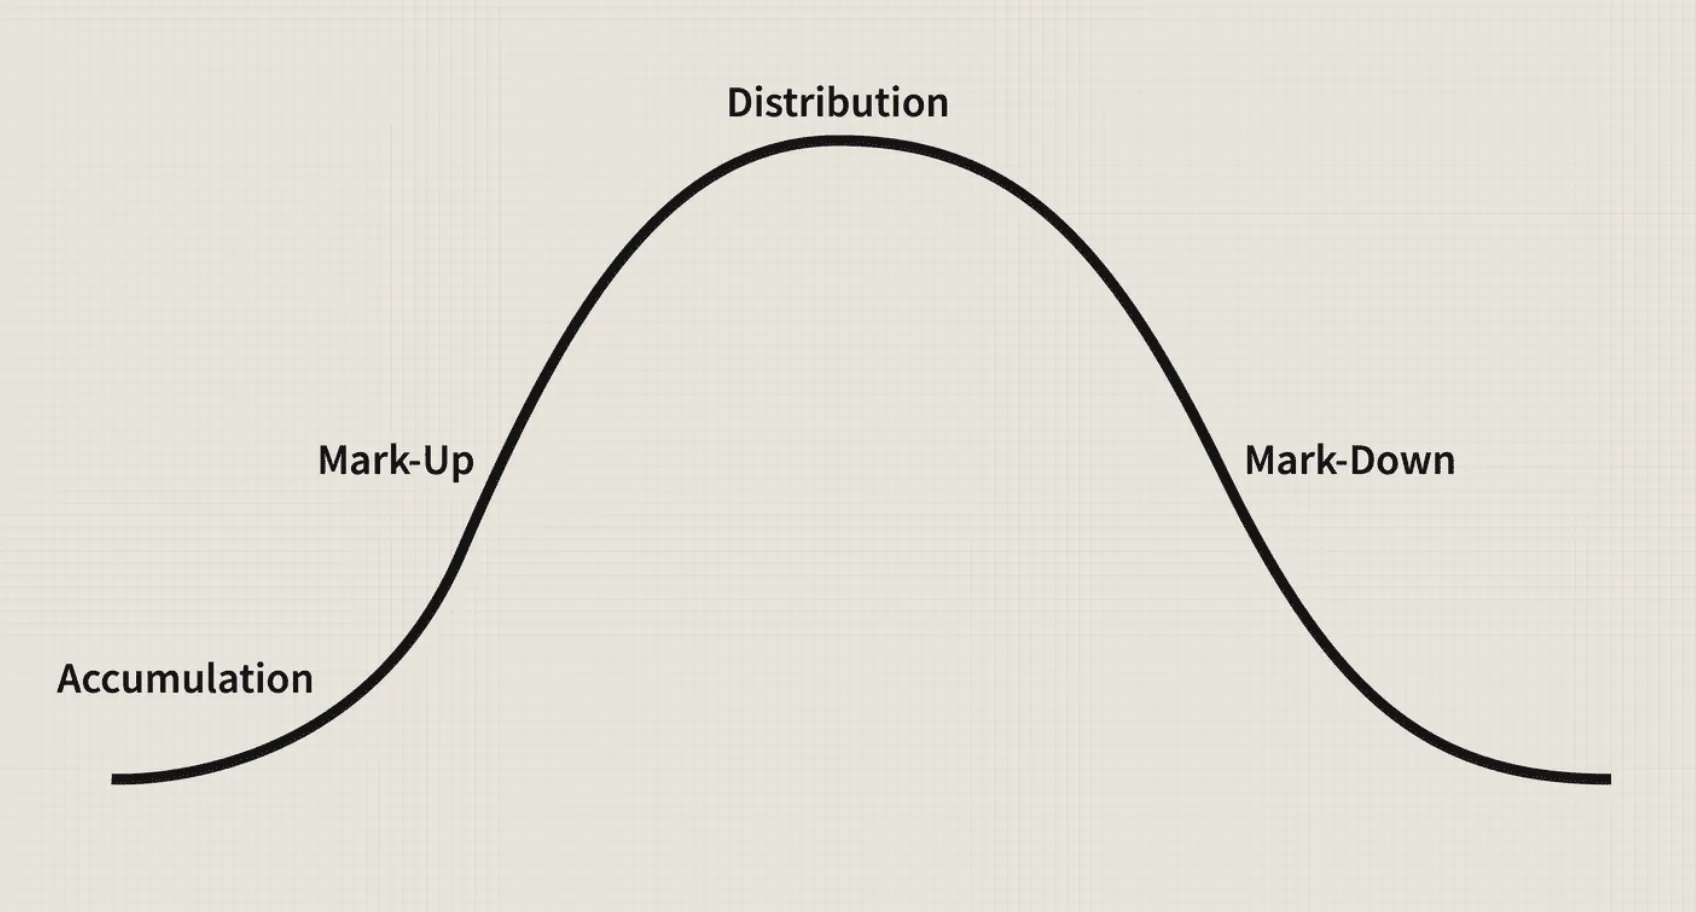
The chart above captures the essential shape of every major market cycle. Note that the curve is not symmetric: the markup phase tends to be gradual and extended, while the markdown phase is often sharper and faster - reflecting the asymmetry of human emotion. Greed accumulates slowly; fear sells quickly.
- Prices stabilise after long decline
- Sideways, range-bound action
- Low volume; retail disinterested
- Smart money quietly buying
- Most undervalued assets here
- Price breaks above accumulation range
- Higher highs and higher lows
- Volume rises on up-moves
- Trend-followers and public enter
- Where most investors make money
- Choppy, directionless price action
- Rallies met by heavy selling
- High volume, little price progress
- Smart money distributing to public
- FOMO at maximum intensity
- Price breaks below distribution support
- Lower lows and lower highs
- Volume spikes on down-moves
- Fear becomes dominant emotion
- Ends when selling is exhausted
This four-stage model is a framework for orientation, not a precise trading rulebook. Real markets do not label themselves. The transition between stages is often only clear in hindsight. The accumulation and distribution phases are the hardest to identify in real time - they look like indecision and noise to most market participants, which is precisely what allows smart money to operate in them without alerting the crowd.
Stage Deep Dive - Accumulation & Markup
The two rising phases of the cycle - where patient capital is built and rewarded. Understanding them in detail allows you to recognise entry opportunities and manage position sizing through the uptrend with discipline rather than emotion.
Stage 1: Accumulation - The Bottom
The accumulation phase marks the bottom of a market cycle. After a prolonged markdown, selling pressure subsides and prices begin to stabilise, moving sideways within a defined range. Pessimism is still widespread. Media coverage is negative. Most retail investors have either sold or are refusing to buy. This is the phase where assets are most undervalued and where the seeds of the greatest long-term gains are sown - but it is also the hardest phase in which to act, because nothing around you suggests that action is warranted.
The institutional investors who operate in this phase - the "smart money" - are buying quietly from the last of the capitulating sellers. Their purchases are designed not to alarm. They absorb supply gradually, preventing sharp upward moves that would attract attention and raise prices before they have finished building their positions. The accumulation phase ends when there are no more willing sellers at current prices, and even a marginal increase in buying pressure begins to push the price higher.
| Element | Accumulation Phase | Markup Phase |
|---|---|---|
| Price Action | Sideways; range-bound; bottoming patterns forming | Clear uptrend; higher highs and higher lows; strong breakout from accumulation range |
| Volume | Subdued; occasional spikes at selling climaxes; dries up at range lows | Increases on up-moves; contracts on pullbacks - confirming trend strength |
| Investor Psychology | Anger → Depression → Disinterest; "the market is broken" | Disbelief → Hope → Optimism → Belief; "this rally looks real" |
| Smart Money | Quietly accumulating large positions from capitulating sellers | Holding positions; adding more on minor pullbacks and consolidations |
| News Sentiment | Negative; few positive catalysts visible; most narratives are bearish | Improving; corporate earnings begin to beat expectations; economic data stabilises |
| Investment Opportunity | Highest long-term upside; most uncomfortable to act | Best risk/reward for trend-followers; corrections are buying opportunities |
Stage 2: Markup - The Bull Market
The markup phase begins when price decisively breaks above the accumulation range, typically on a surge in volume. This breakout signals that buyers have overwhelmed sellers. Trend-followers and momentum investors begin entering, which itself pushes prices higher, attracting more participants in a self-reinforcing cycle. The narrative shifts from "this market is broken" to "this rally is real" to "I need to be fully invested."
The markup phase is typically the longest phase of the cycle. It is punctuated by corrections - temporary pullbacks of 5–15% that shake out the weakest hands before the trend resumes. These corrections feel alarming in the moment but are healthy and necessary. The investor who identifies that they are in a markup phase and treats corrections as opportunities rather than threats captures most of the cycle's return. The investor who treats every correction as the beginning of the next bear market ends up constantly underinvested during the best stretches of the cycle.
Stage Deep Dive - Distribution & Markdown
The two declining phases - where fortunes made in the markup are protected or lost depending on how clearly you can read the warning signs. These stages are where most investors make their costliest mistakes, driven by the euphoria of Stage 2 lingering too long into Stage 3.
Stage 3: Distribution - The Top
The distribution phase is the topping process. After a long and powerful markup, the smart money that accumulated during Stage 1 begins to sell - distribute - its holdings to the public. This selling is almost always masked by peak market euphoria. Late-arriving investors, driven by fear of missing out, eagerly buy the very shares that institutional money is quietly offloading. The market appears healthy from the outside; internally, the balance of power is shifting from buyers to sellers.
The defining characteristic of distribution is that high volume produces little or no upward price progress. Analysts call this "churning." The market is busy - lots of activity, lots of news, lots of new retail money flowing in - but prices stop making new highs. Or they make new highs on increasingly weak volume. These divergences are the market's early warning system, and they go ignored by most retail investors precisely because sentiment is at its most optimistic exactly when these warning signs appear.
Stage 4: Markdown - The Bear Market
The markdown phase begins when price breaks below the support level established during distribution, confirming that sellers have taken control. A clear downtrend of lower lows and lower highs emerges. What had previously felt like brief dips now becomes sustained decline. The investor who held through the distribution phase hoping for "one more leg up" is now watching their gains erode week by week.
| Element | Distribution Phase | Markdown Phase |
|---|---|---|
| Price Action | Choppy; sideways; struggles to make new highs; "churning" on high volume | Consistent downtrend; lower lows and lower highs; support levels broken one after another |
| Volume | High but price advances weakly - a major warning sign | Spikes on sharp down-days; confirms strength of selling pressure |
| Investor Psychology | Euphoria → Complacency → Greed; FOMO buying from latecomers | Anxiety → Denial → Panic → Capitulation; fear becomes the governing emotion |
| Smart Money | Skillfully distributing positions to eager retail buyers without causing panic | Short or in cash; waiting patiently for the next accumulation phase |
| News Sentiment | Still positive - earnings peak often coincides with distribution; optimism pervasive | Deteriorating rapidly; recession fears, credit events, earnings misses compound the decline |
| Investment Lesson | High volume + no price progress = reduce risk; do not wait for confirmation of the bear market to act | Bear markets end with capitulation; the best buying opportunities arrive when news is worst and fear is peak |
The markdown phase ends when selling is exhausted - when the last panic sellers have sold and no new sellers emerge at current prices. This is capitulation, and it marks the birth of the next accumulation phase. The cycle then begins again, wearing a different dress but following the same fundamental script.
The Psychology of the Market Cycle
If economics and earnings were the only drivers, market cycles would be far more subdued. The wild swings from boom to bust - the bubbles and the crashes - are fuelled by the most powerful and unpredictable force in markets: human emotion. The collective psychology of market participants is what amplifies the underlying cycle, causing markets to overshoot fair value on the way up and undershoot it on the way down.
The psychological journey through a market cycle is so consistent and predictable that it has been mapped into a model known as the "Psychology of a Market Cycle" - sometimes called the Wall Street Cheat Sheet. It provides a narrative overlay to the four mechanical stages, explaining the why behind the what.
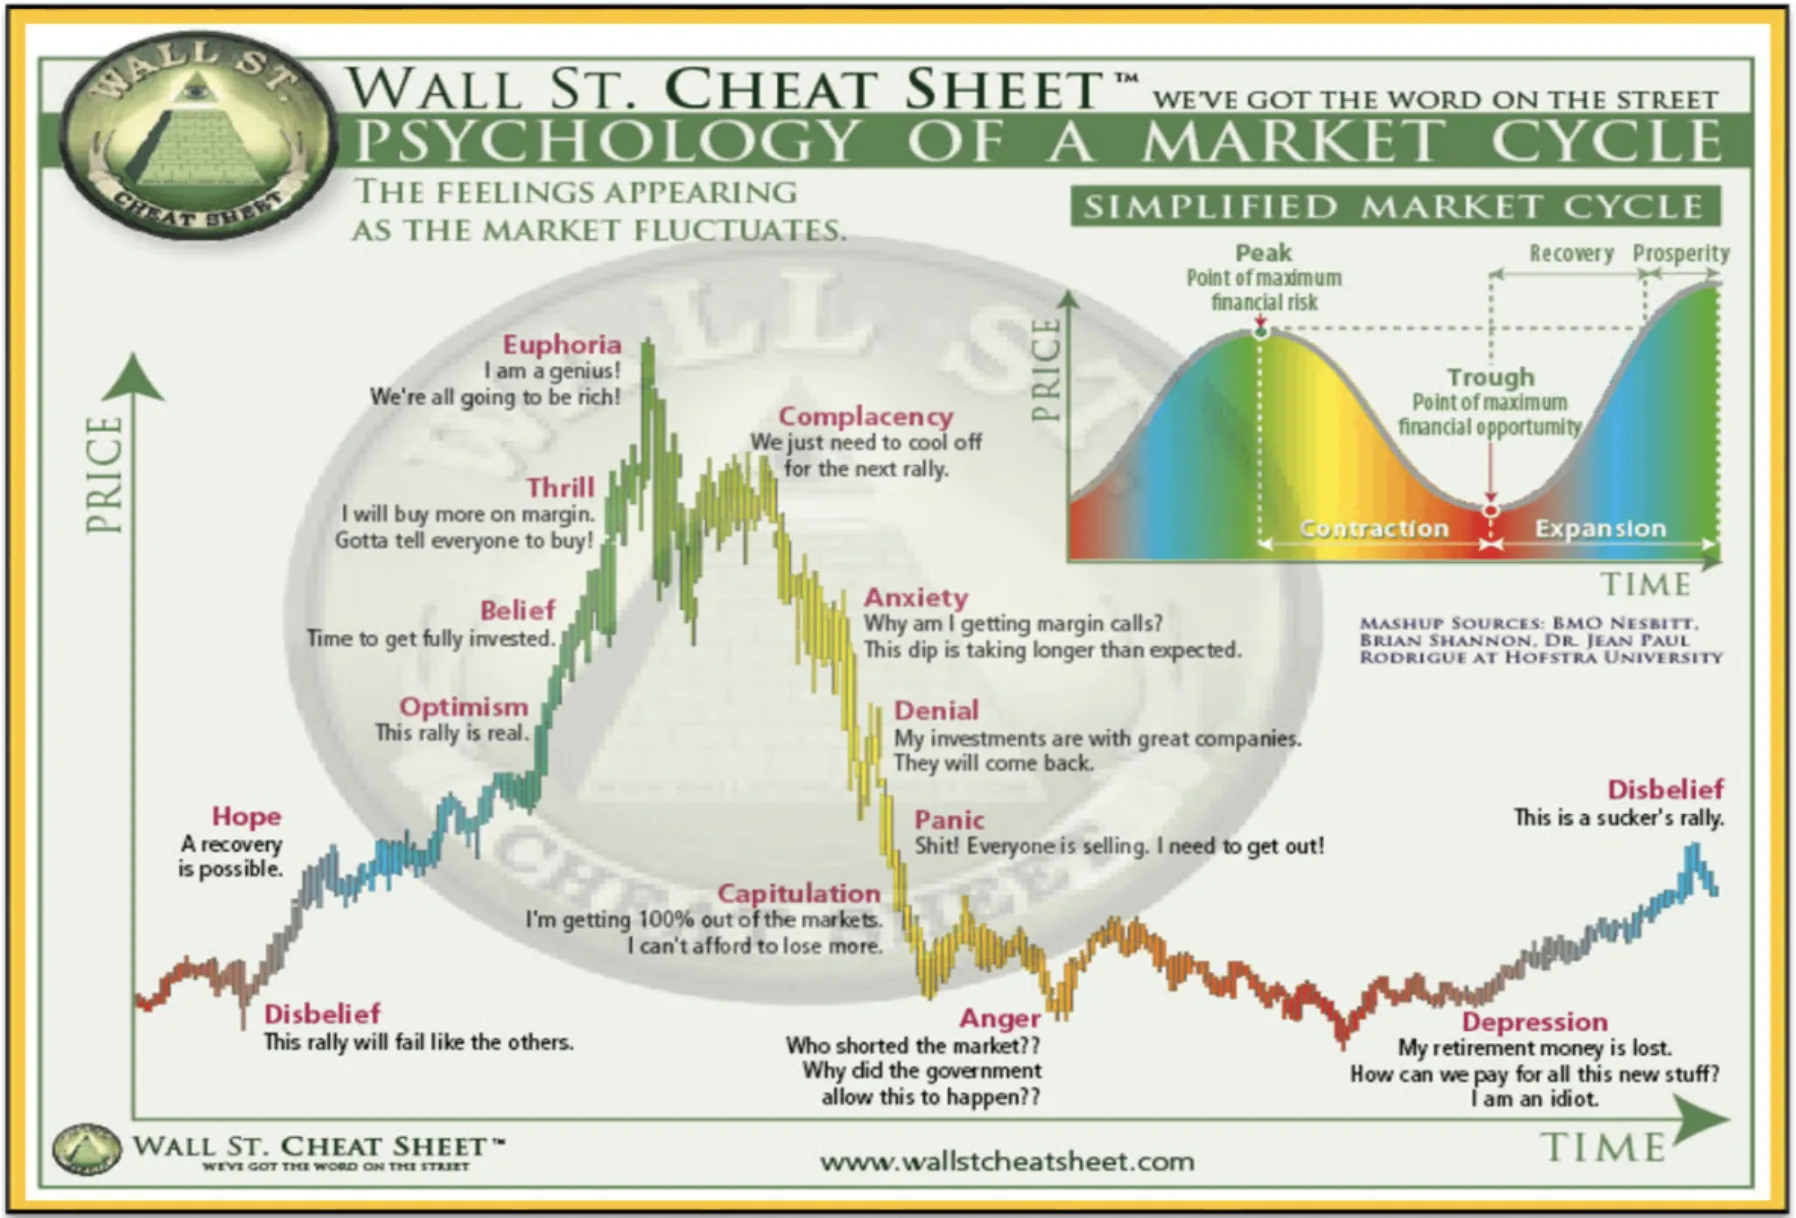
The chart above maps 14 distinct emotional states onto the price curve of a typical cycle. Study the position of each emotion carefully. The most important observations: Euphoria - where investors feel invincible and the "this time is different" narrative takes hold - coincides precisely with the peak of the market, the point of maximum financial risk. And Depression - where there is a pervasive sense of hopelessness and investors vow never to invest again - coincides with the trough, the point of maximum financial opportunity.
The psychological cycle is a self-reinforcing feedback loop. The greed during euphoria attracts the last buyers at the highest prices, providing the liquidity for smart money to sell. The fear during panic and capitulation compels the weakest hands to sell at the lowest prices, allowing smart money to accumulate. Every cycle, without exception, transfers wealth from the emotionally reactive to the emotionally disciplined.
The 14 Phases of the Investor Emotion Cycle
Below is the full map of investor sentiment through a complete market cycle. Each phase has a distinct emotional character, a recognisable narrative, and a specific investment implication. Learning to locate yourself on this map - honestly, without ego - is one of the most valuable skills in investing.
The most actionable insight from this map is the location of the two extremes. Euphoria is the precise moment most retail investors feel most confident - and it marks the market's peak. Depression and Capitulation are the moments when most retail investors feel most defeated and most certain that investing is hopeless - and they mark the market's trough. The cycle is a systematic, repeating wealth transfer from those who are led by their emotions to those who have learned to manage them.
Overcoming the Six Behavioural Biases
Recognising these hardwired psychological biases in yourself is the first and most critical step toward making more rational investment decisions. Each bias has a known mechanism and a practical antidote. None of them can be eliminated entirely - but they can be managed.
Time in the Market > Timing the Market
Given the existence of cycles, the temptation to time the market - sell at the top, buy at the bottom - is immense. But a vast body of evidence shows that for the vast majority of investors, including most professionals, consistently timing the market is a losing strategy. Here is why - and what to do instead.
The Evidence Against Market Timing
Successful market timing requires two correct decisions: when to sell and when to buy back in. Getting just one of these wrong can be devastating. But the structural problem runs deeper than that. Research consistently shows that a disproportionate share of the stock market's long-term gains are concentrated in a very small number of exceptionally strong days - and those days tend to cluster at the beginning of recoveries, precisely when sentiment is still worst and most investors are still on the sidelines.
Missing just the 10 best trading days over a 20-year period cuts the average investor's total return roughly in half. Missing the 20 best days reduces it by approximately two-thirds. These are not outlier days that could easily be avoided - they are often the explosive days that follow the worst declines, the days that feel like "just another dead-cat bounce" to those who capitulated.
| Strategy | Mechanism | Result | Verdict |
|---|---|---|---|
| Market Timing | Selling to avoid declines; buying back at lows | Must be right twice; misses clustered best days; incurs transaction costs and capital gains taxes | Consistently underperforms for the vast majority |
| Time in the Market | Remaining invested through the full cycle; reinvesting dividends | Captures all recovery days; benefits from compounding; lower taxes and costs | Outperforms timing strategies over 10+ year periods |
| Dollar-Cost Averaging | Investing a fixed amount on a regular schedule regardless of price | Buys more shares when prices are low; reduces average cost; removes timing emotion | Superior to lump-sum market timing for most investors |
| Cycle-Aware Allocation | Adjusting asset class weights as cycle progresses without going to cash | Reduces risk at peaks; adds risk at troughs; maintains market exposure throughout | The optimal middle path for sophisticated investors |
Cycle-Aware Investing in Practice
Cycle-aware investing is emphatically not the same as market timing. You are not making all-or-nothing bets on short-term direction. You are tilting your portfolio's risk exposures - asset allocation, sector weights, position sizing - based on the longer-term phase of the economic and market cycle. The goal is to tilt the odds in your favour, not to predict the future with precision.
In practice this means: during late markup and distribution (elevated valuations, euphoric sentiment, flattening or inverted yield curve), reduce exposure to the most speculative holdings and increase the quality and defensiveness of your portfolio. During markdown and accumulation (depressed valuations, peak pessimism, normalising yield curve), add to high-quality positions and build positions in sectors with cyclical leverage to recovery. Never go fully to cash - remain in the market, adjusted for the cycle's risk profile.
PolyMarket Investment, Research Team, February 2025