We've been circling Bristol-Myers Squibb for about six months, watching it trade sideways near multi-year lows while the sell-side slowly capitulates toward a more constructive view. The stock is down roughly 42% from its 2022 peak, yielding above 5%, and trading below 7x forward earnings - in a sector where the average multiple is 15x. On paper, that looks like a screaming value opportunity. The reality is somewhat messier, and that's precisely why the discount exists.
BMY is in the middle of one of the more visible portfolio transitions in Big Pharma. Its legacy blockbusters - Revlimid and Sprycel - are being shredded by generic competition, with Revlimid revenue down 44% year-over-year. Meanwhile, a new generation of growth drugs is accelerating: Camzyos up 89%, Reblozyl up 35%, Krazati up 125%, and the newly approved Cobenfy targeting a $5 billion schizophrenia market. The question isn't whether the growth portfolio will take over - it already has. As of Q1 2025 both sides of the ledger sit at roughly $5.6 billion in quarterly revenue. The question is how quickly investors re-price the story once that transition is undeniable in the numbers.
Add a $40 billion US investment commitment, an $11 billion BioNTech pipeline deal, and a balance sheet generating $13–15 billion in free cash flow annually, and what you have is a company that is actively building toward a 2027–2028 earnings inflection - while paying you a 5%-plus dividend to wait. That combination is rare. We're long here.
The Numbers That Matter
Q1 2025 came in well ahead of expectations: revenue of $11.2 billion beat consensus by $490 million, and non-GAAP EPS of $1.80 beat by $0.30 - a 19.9% upside surprise. Guidance was raised for the full year. At the current price, the valuation metrics are historically extreme - and not in the direction the market typically punishes.
The Great Rotation: Legacy Erodes, Growth Accelerates
This is the crux of the BMY investment thesis. The market is pricing in the legacy collapse without adequately crediting the growth acceleration. By Q1 2025, growth drugs matched legacy revenue at ~$5.6 billion each. The crossover is not a projection - it has already occurred. The growth portfolio needs to gain roughly $1.5–$2 billion more per year to fully offset Revlimid's terminal decline, and the trajectory of current approvals suggests that is achievable by 2026–2027.
Cobenfy deserves special mention. Approved in September 2024 for schizophrenia - a disease area without a genuinely new mechanism of action in decades - it generated $27 million in its first partial quarter of commercial launch. Management projects a $5 billion peak revenue opportunity by 2030. That's not a footnote; if it materialises, Cobenfy alone could represent more than 10% of BMY's entire current annual revenue.
A 35% Discount to Its Peer Group
When you line up BMY against the large-cap pharma peer set, the valuation gap is stark. The company is not trading at a marginal discount - it is trading at levels that imply either zero growth forever or a significant structural deterioration that the fundamental evidence doesn't support.
| Company | Fwd P/E | Div. Yield | FCF Yield | Valuation |
|---|---|---|---|---|
Bristol-Myers Squibb BMY |
6.7x | 5.3% | 13%+ | DEEP VALUE |
Merck & Co. MRK |
11x | 3.3% | 7% | FAIR VALUE |
AbbVie ABBV |
14x | 3.5% | 6% | FAIR VALUE |
Johnson & Johnson JNJ |
14x | 3.3% | 5% | FAIR VALUE |
Healthcare Sector Median |
15x | 2.8% | 4–5% | BENCHMARK |
BMY is currently trading at roughly −1 standard deviation from its own 10-year average P/E multiple. Even applying a conservative 10x multiple to the midpoint of FY2025 guidance ($6.85 EPS) yields a fair-value target of $68.50. At the healthcare median of 15x, the implied target exceeds $100. We're not anchoring to either extreme - the market clearly has concerns, which is why the discount exists. But even a partial re-rating to 10–11x P/E, which is still below every peer in the table, gets us comfortably to $65–$70 and well above the initial price target.
The BioNTech Deal: $11 Billion for a Potential Blockbuster
In early June 2025, BMY announced a deal to license BNT327 - a bispecific antibody targeting both PD-L1 and VEGF-A - from BioNTech, for a total consideration of up to $11 billion. This is not a speculative early-stage bet. Phase III trials in lung cancer are already underway, and Phase III in breast cancer was scheduled to initiate in H2 2025. The target indication - solid tumors - represents an estimated $375 billion global market by 2034.
BMY × BioNTech - BNT327 Licensing Deal
TOTAL VALUE: UP TO $11B$40 Billion US Investment: Manufacturing Firepower for the Decade Ahead
In the context of the Trump administration's push for domestic pharmaceutical manufacturing, BMY committed to investing $40 billion in US-based research and manufacturing over the next five years. This is not purely a political concession. It reflects the company's genuine pipeline confidence - you don't commit $40 billion to US manufacturing capacity if your internal growth projections are bearish. This commitment also provides meaningful protection against the tariff risk that has weighed on the sector, since domestically manufactured drugs are structurally less exposed to import duty regimes. With 18 sell-side upgrades versus just 5 downgrades over the prior 90 days, the institutional view is steadily re-aligning.
35 Years of Consecutive Dividends - and Still Growing
BMY Dividend Track Record
Bristol-Myers Squibb has paid a dividend every year for 35 consecutive years and raised it for 17 consecutive years. The most recent increase - 3.3% in December 2024 to $0.62 per quarter - was made against a backdrop of significant legacy headwinds, which speaks to management's confidence in the sustainability of the payout. At a normalized payout ratio of 33–36%, the dividend is covered more than 2.5x by free cash flow. This is not an at-risk dividend.
Prescription vs. Side Effects: What Could Go Wrong
We don't dismiss the bear case. BMY has earned its skeptics. Here are the four material risks we're carrying in the model.
Technical Setup: Below Every Moving Average - and That's the Point
The chart is not pretty. BMY peaked at $81.43 in early 2023 and has spent two years declining, building a death cross (50dma below 200dma) and an RSI that, until recently, was pressing the floor of the bearish 20–60 range. However, the setup at this price level has characteristics that tend to precede meaningful mean-reversion moves in value stocks.
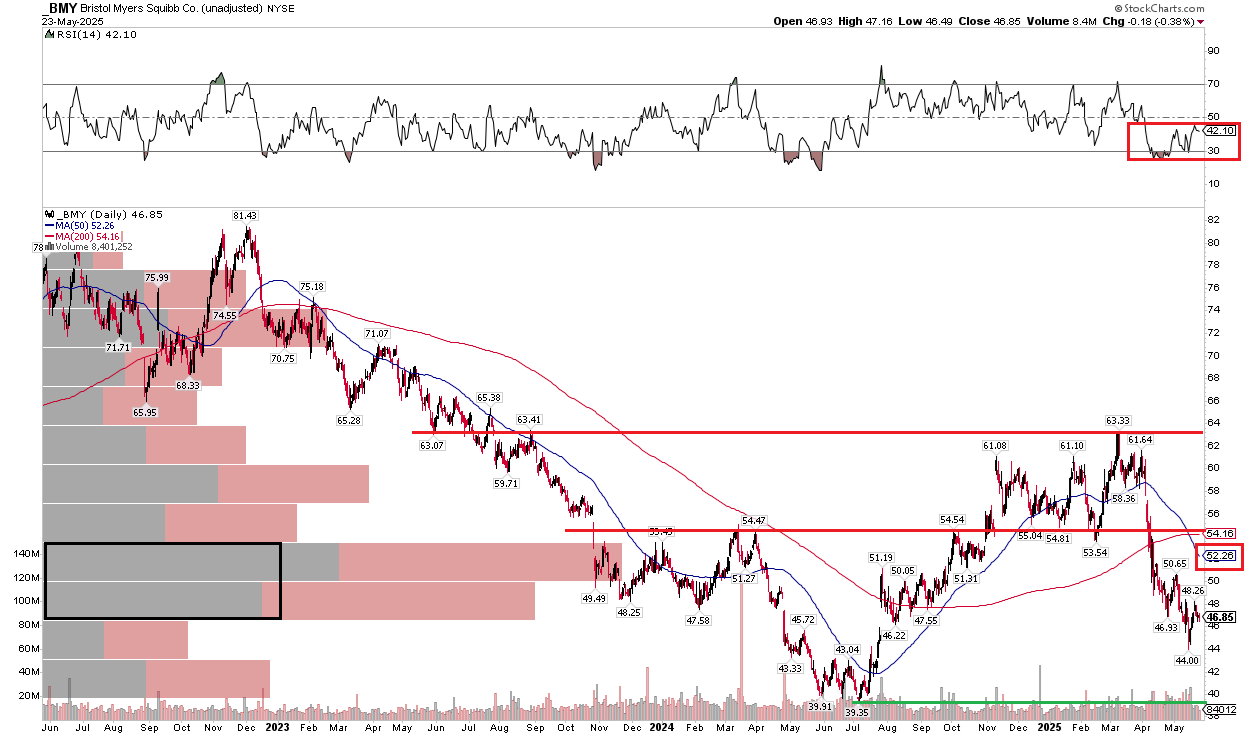
Three technical observations stand out. First, the stock is trading at approximately the same price level it last touched in late 2020, which provides meaningful long-term structural support. Multi-year base formations at a level this widely owned don't typically give way without a fundamental deterioration that we're not seeing. Second, the RSI at 42.10 is still in bearish territory, but the extremes of the recent lows (near 30) appear to be behind us, and the PPO divergence study is showing improving momentum even as price drifts lower - a classic technical setup for a value reversion. Third, the $44 support level (which corresponds closely to the lower Bollinger Band at $44.49) has held twice. The 2024 structural low of $39 represents a clearly defined maximum risk level for a long position entered in the $45–$48 zone.
Our entry zone is defined by the $44–$48 band. First resistance once the 50dma catches down is the $52–$54 EMA cluster, and then the $55 zone where longer-term sellers have previously stepped in. A clean break through $55 would, in our view, trigger a re-rating targeting the $60–$63 region - where the stock was trading just eight months ago before the most recent leg down.
Three Paths Forward Over 12 Months
| Scenario | Driver | Price Target | Total Return (inc. div.) | Probability |
|---|---|---|---|---|
| Bear | Legacy decline accelerates; Eliquis guidance cut; BNT327 Phase III paused. Multiple compression to 6x. | $38–$42 −11% to −19% |
−6% to −14% (dividend partially offsets) |
20% |
| Base | Growth portfolio covers legacy. Cobenfy ramp continues. Q3/Q4 earnings beats. Multiple expands to 8–9x. | $55–$60 +17% to +28% |
+22% to +33% (+5.3% dividend) |
55% |
| Bull | BNT327 Phase III data positive. Cobenfy exceeds ramp estimates. Sector rotation into value pharma. Multiple to 11x. | $65–$75 +38% to +60% |
+43% to +65% (+5.3% dividend) |
25% |
The Catalyst Map Through 2026
The timeline is densely populated with near-term events that could serve as re-rating triggers well within the 6–12 month horizon.
The Trade
The following scenarios reflect the author’s personal analysis and are not investment recommendations. See our full disclaimer.
BMY offers a rare combination: a stock at its cheapest valuation in a decade, a 5.3% dividend yield covered 2.6x by free cash flow, a growth portfolio that has already reached revenue parity with the legacy business, and a credible pipeline catalyst in BNT327. The market is pricing in the worst-case legacy scenario and attributing almost no value to the $40B investment commitment or the BioNTech pipeline.
Our position is sized to benefit from the eventual re-rating while the dividend compensates for the wait. Stop below the 2024 structural low at $39–$40. Above $55, we'll reassess the target and consider adding. Above $63, the original thesis is fully validated - the stock has merely returned to where it was eight months before this note was written. The SA Quant rating of A+ for Valuation, Growth, and Profitability simultaneously is one of the rarest signals in large-cap screens. We've not seen it ignored indefinitely.
Important Disclaimer
This content is for informational and educational purposes only and does not constitute financial advice, investment recommendations, or solicitation to buy or sell any securities. Past performance does not guarantee future results. All investments carry risk, including the possible loss of principal. Bristol-Myers Squibb (NYSE: BMY) is subject to clinical trial risk, regulatory risk, patent cliff risk, generic competition, drug pricing regulation, tariff risk, and general market risk. The BioNTech pipeline deal (BNT327) involves significant clinical and regulatory uncertainty. Dividend payments are not guaranteed and may be reduced or eliminated. All valuation estimates are based on publicly available information and independent analytical models as of June 30, 2025; actual results may differ materially. Always conduct your own due diligence and consult a qualified financial advisor before making any investment decision.