Most of the market tips we write are about companies - businesses with earnings, moats, management teams, and narratives that can shift. This one is different. JEPQ isn't a company. It's a strategy. And like any strategy, the question isn't whether the instrument is good in the abstract - it's whether the current moment is the right one to deploy it. Right now, at the close of December 2025, I believe it is.
The Nasdaq-100 had an exceptional year. AI spending exploded, the hyperscalers reported strong numbers, and the index climbed relentlessly from its April 2025 lows near $44 on QQQ. But as we sit here at year-end, cracks are beginning to show. The competitive intensity among the Magnificent Seven has never been higher - Google, Microsoft, Meta, and Amazon are collectively committing to nearly $700 billion in AI capital expenditure in 2026, a figure that would have seemed fantastical three years ago. Markets are starting to ask whether returns will justify the spend. That question alone tends to make for a choppier tape.
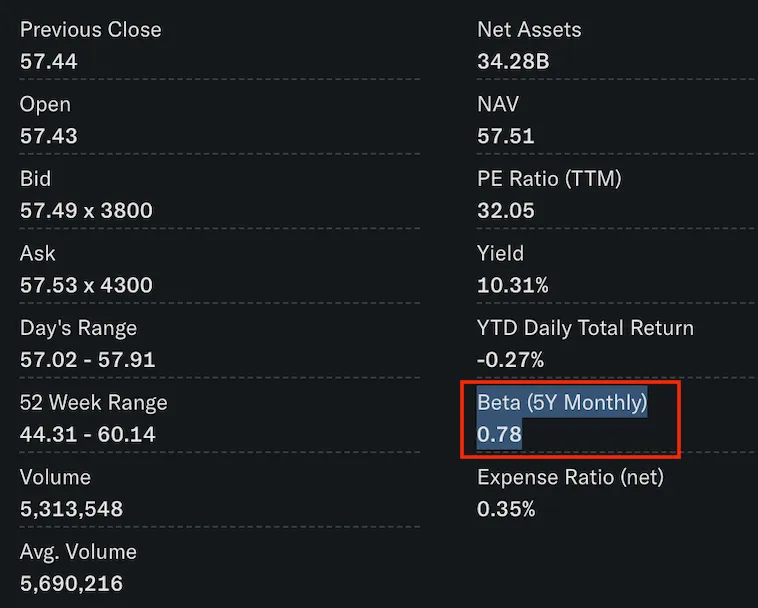
Choppy markets, as it happens, are exactly where JEPQ earns its keep. The fund sells out-of-the-money covered calls on the Nasdaq-100 every month, collecting premium income regardless of which direction the index drifts. At $57 today, that premium translates to a trailing yield of roughly 10.3% - $5.88 per share per year, paid monthly - while keeping most of the downside buffer that comes with 107 carefully selected Nasdaq names. Entry zone $56–$58. Target $62–$66 over 9–12 months.
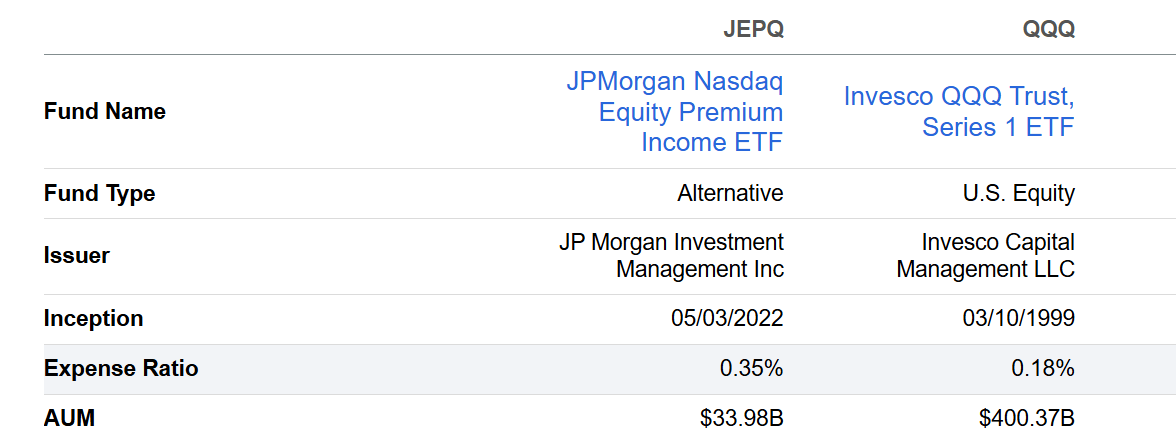
Before making any case for the trade, it's worth being precise about what JEPQ is and - just as important - what it isn't. This distinction matters more than it does for a typical stock tip, because covered call ETFs are widely misunderstood by retail investors who either treat them as bond substitutes or dismiss them entirely as "return-capped."
The upside cap criticism is real but often overstated. Investors who bought QQQ through 2023–2024 would have collected every percentage point of a 50%+ bull run. JEPQ would have clipped some of that. Fair. But that scenario - a multi-year rip with few corrections - is precisely the environment where covered calls underperform. The question is whether we're entering that kind of market in 2026, or something altogether choppier.
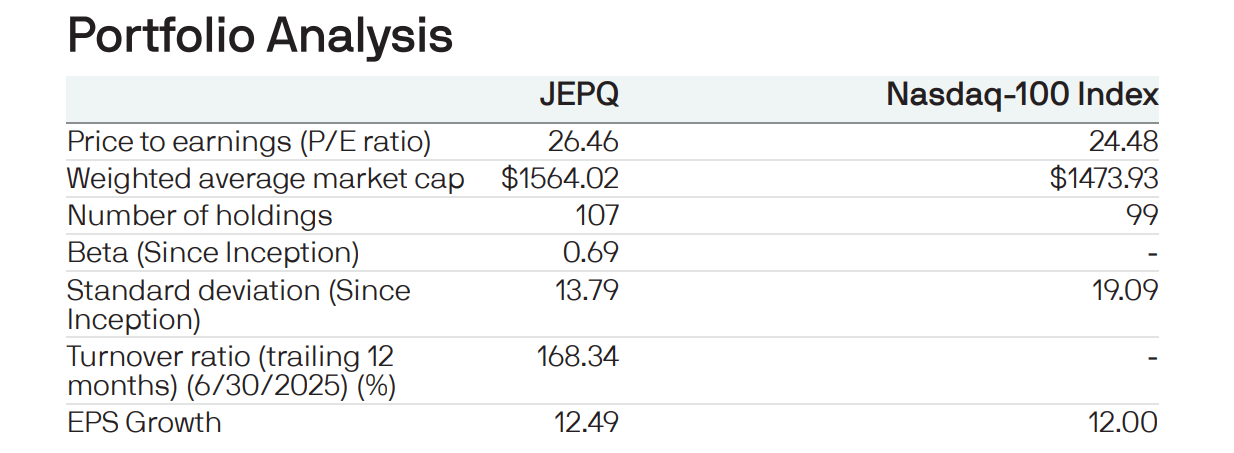
JEPQ's equity sleeve holds 107 names - a mix of Nasdaq-100 positions with a few off-benchmark holdings permitted up to 20% of NAV. In practice, the top 10 holdings look almost identical to QQQ. The real differences emerge in the weights. JEPQ's model underweights the most volatile, most richly valued names while maintaining sufficient exposure to benefit from any Nasdaq strength.
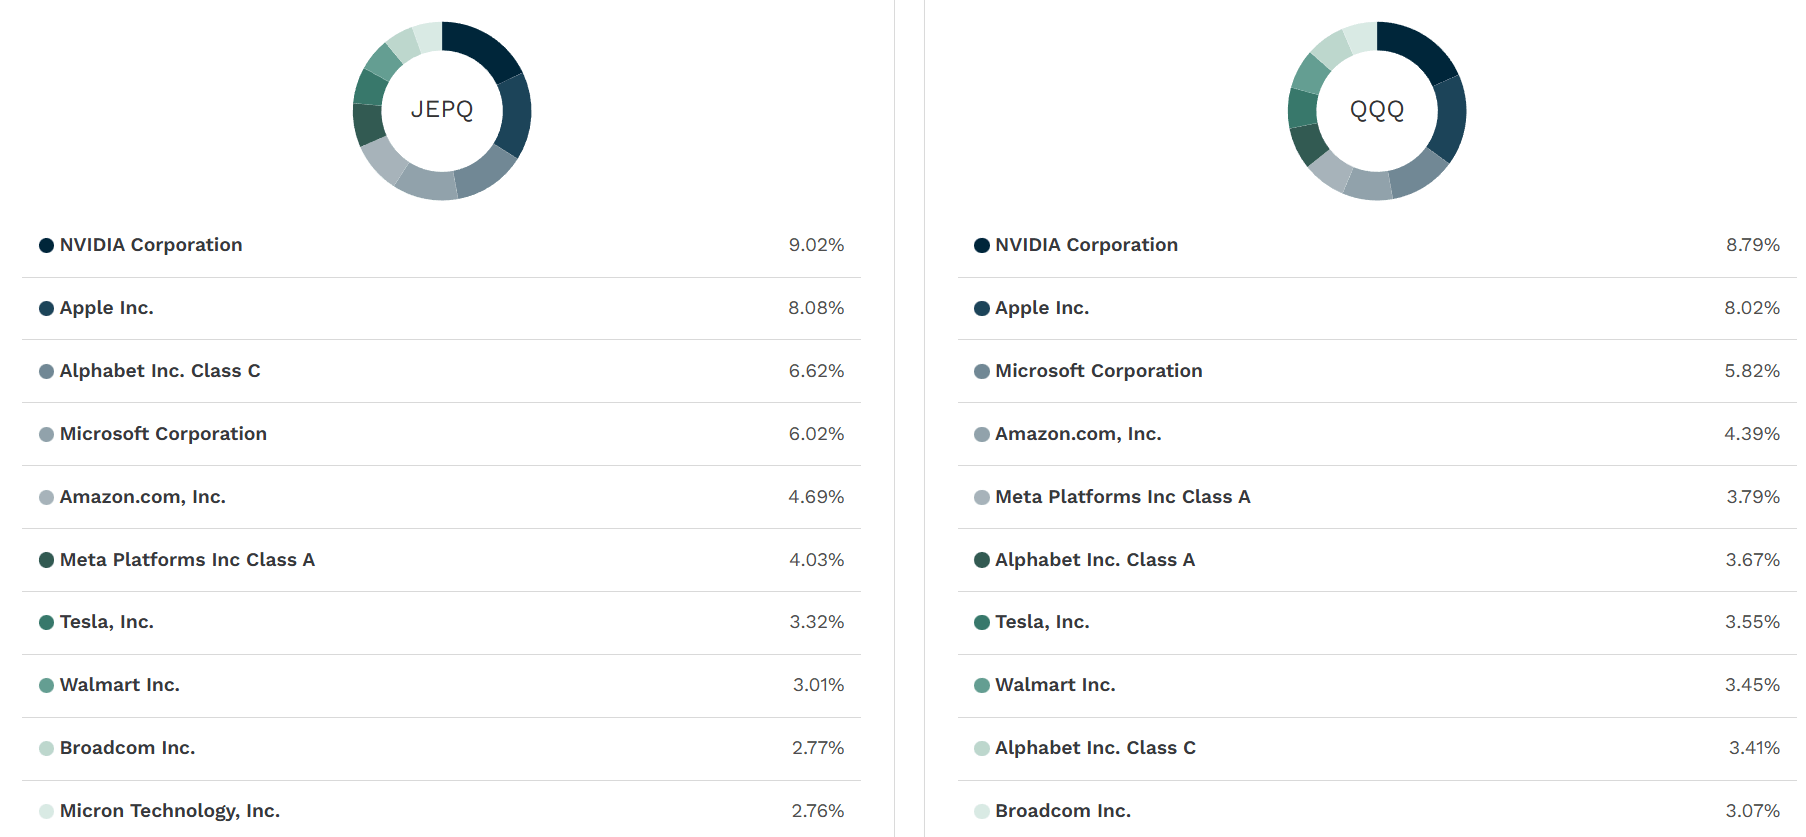
There is a subtle but meaningful insight embedded in this holdings comparison. JEPQ's quantitative selection tends to underweight the names with the highest valuations and the greatest sensitivity to AI spending narratives - exactly the names that drove QQQ's 2024 outperformance but now carry the most execution risk as CAPEX commitments balloon. Heading into 2026 with $700B in industry AI spend planned, a portfolio that's slightly less dependent on those names isn't a bug. It's a feature.
The single most important input to a covered call ETF thesis is not the fund itself - it's the market environment you're walking into. JEPQ performs best when the underlying index trends sideways, oscillates in a range, or delivers only modest gains. It underperforms when the market rips cleanly and sustainably upward. So the core question here is: what does 2026 look like for the Nasdaq-100?
The AI Arms Race Is Entering Phase Two
The 2023–2024 bull run was about AI possibility - markets pricing in potential. Phase Two is about AI execution: can these companies monetise the spend? Google, Microsoft, Meta, and Amazon collectively plan $700B+ in 2026 CAPEX. The market's patience for ROI is finite. Elevated uncertainty = elevated volatility = better covered call premiums.
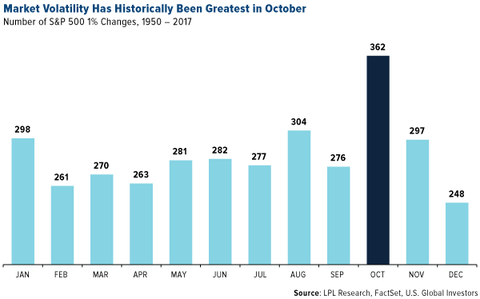
December Is Seasonally One of the Calmer Months - But Mid-December 2025 Has Been Different
S&P 500 recorded only 248 single-day 1% moves in December across a 67-year sample - the fewest of any month. But mid-December 2025 has been an exception, with the VIX climbing rather than subsiding as year-end approached. For JEPQ specifically, this is actually an improvement to the setup: higher-than-seasonal volatility in December means covered call premiums are elevated relative to the typical December baseline, generating more income per share sold. The seasonal entry argument here is therefore not about waiting for quiet markets - it is about entering before the Q1 volatility surge historically associated with earnings season and January macro data begins to compress option premiums further. The current elevated VIX is a feature, not a contradiction of the entry thesis.
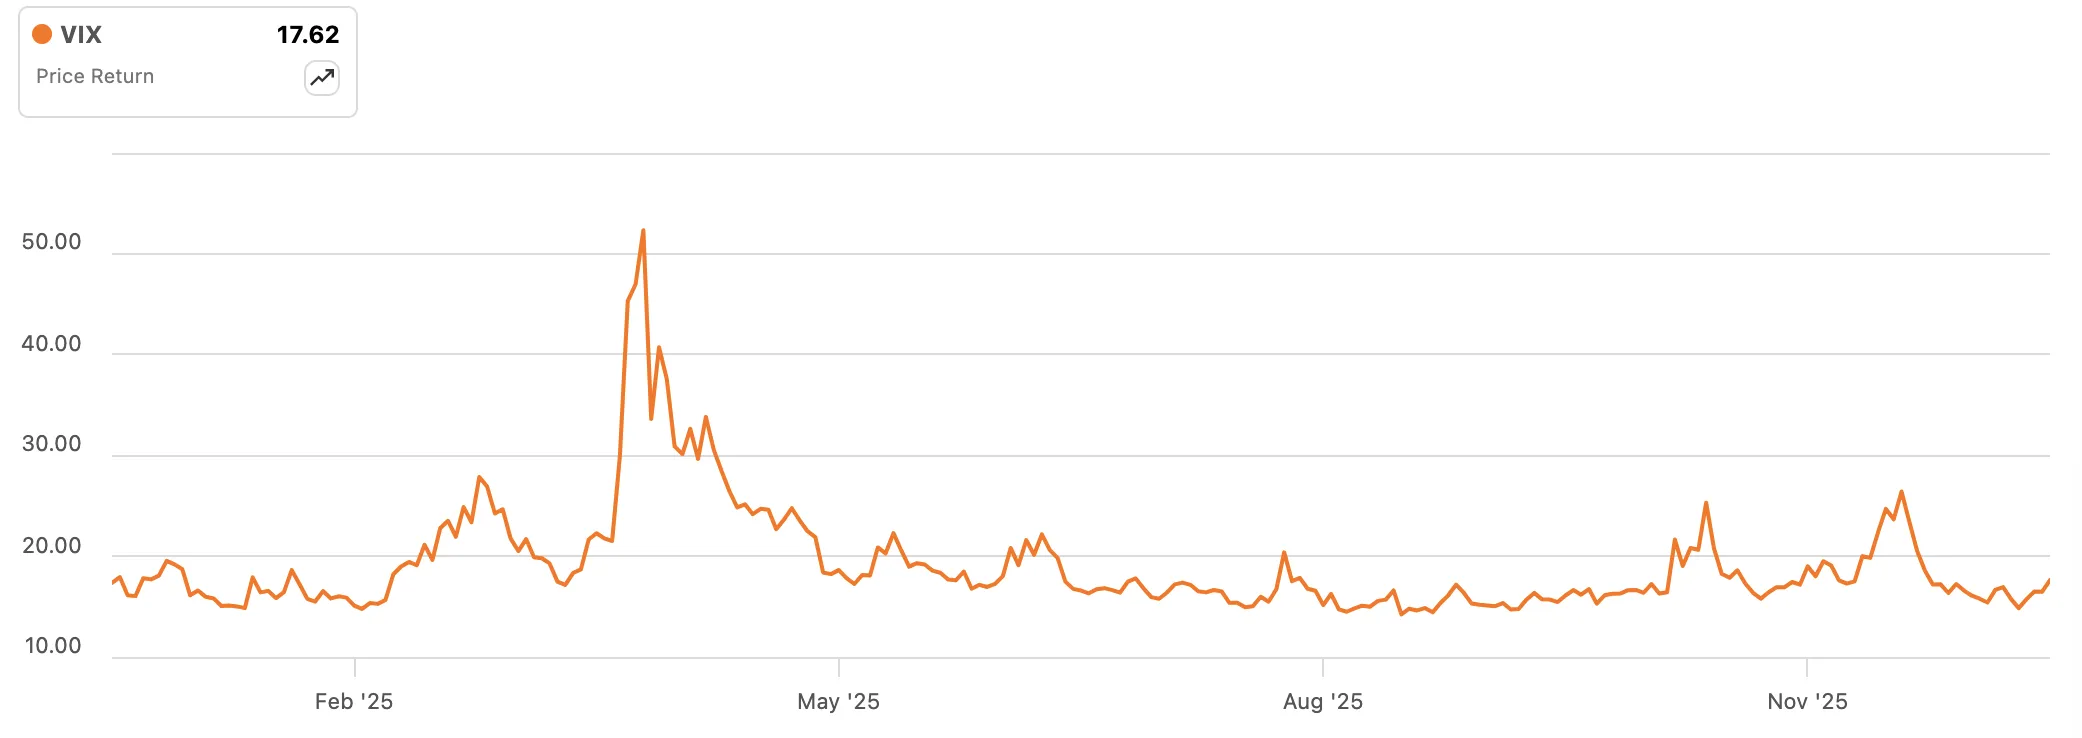
There is a practical timing argument here. VIX spent most of late 2025 in the 14–17 range - calm by historical standards. When volatility is compressed, covered call premiums shrink. But that dynamic is already shifting. The VIX was rising into mid-December, and the macro setup - rate uncertainty, AI capex concerns, and a post-election policy environment - points to more choppiness ahead, not less. Entering JEPQ now means buying just as the premium environment begins to improve, with the seasonal and structural tailwinds reinforcing rather than competing with each other.
JEPQ does not exist in a vacuum. Investors looking at covered call ETFs on the Nasdaq-100 have at least three meaningful alternatives: QYLD, QQQI, and GPIQ. Understanding exactly where JEPQ sits relative to these peers is essential to knowing whether the risk/reward profile actually fits the thesis.
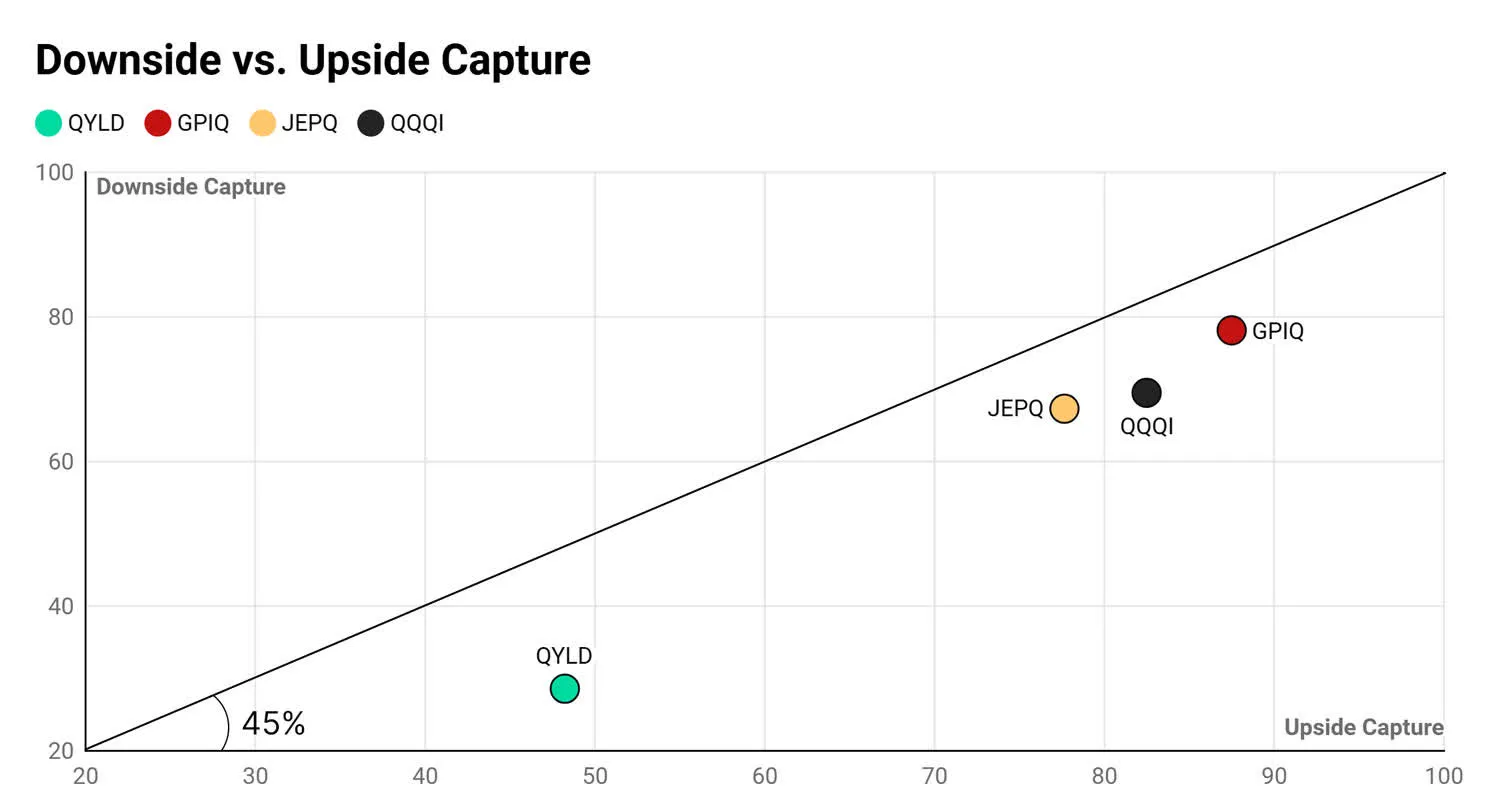
The quadrant above is the most useful single chart for understanding JEPQ's competitive position. GPIQ is the aggressive option - high upside capture, but equally high downside participation. QYLD writes deep at-the-money calls and ends up with the lowest upside capture in the group - approximately 49%. Its approximately 28% downside capture is actually a structural advantage in a sustained bear market, meaning QYLD falls far less than the index and less than alternatives when equity markets drop sharply. The structural disadvantage of QYLD's deeper-in-the-money strategy manifests primarily in bull markets and sideways-to-positive regimes: with only 49% upside capture, it significantly underperforms when markets rise, and those environments constitute the majority of historical market regimes. In a prolonged bear, QYLD's structure would actually shine relative to the index - the problem is that investors are also surrendering most of the upside in the years that precede and follow that bear. QQQI sits in the middle with a more aggressive option overwrite and higher income but less selective equity holdings.
JEPQ's positioning - roughly 78% upside capture against 67% downside capture - is the sweet spot for the thesis we're making. We're not trying to replicate QQQ. We're trying to participate in most of QQQ's performance while collecting income, reducing volatility, and limiting the damage in the choppier environment that Q1 2026 is setting up to be.
| Fund | Yield (TTM) | Upside Capture | Downside Capture | Best Environment |
|---|---|---|---|---|
| JEPQ THIS TIP | 10.3% | ~78% | ~67% | Sideways / Choppy |
| GPIQ | ~10.1% | ~90% | ~80% | Strong bull market |
| QQQI | ~14.2% | ~84% | ~70% | Sideways / High vol |
| QYLD | ~11.6% | ~49% | ~28% | Prolonged bear only |
| QQQ | 0.46% | 100% | 100% | Strong directional bull |
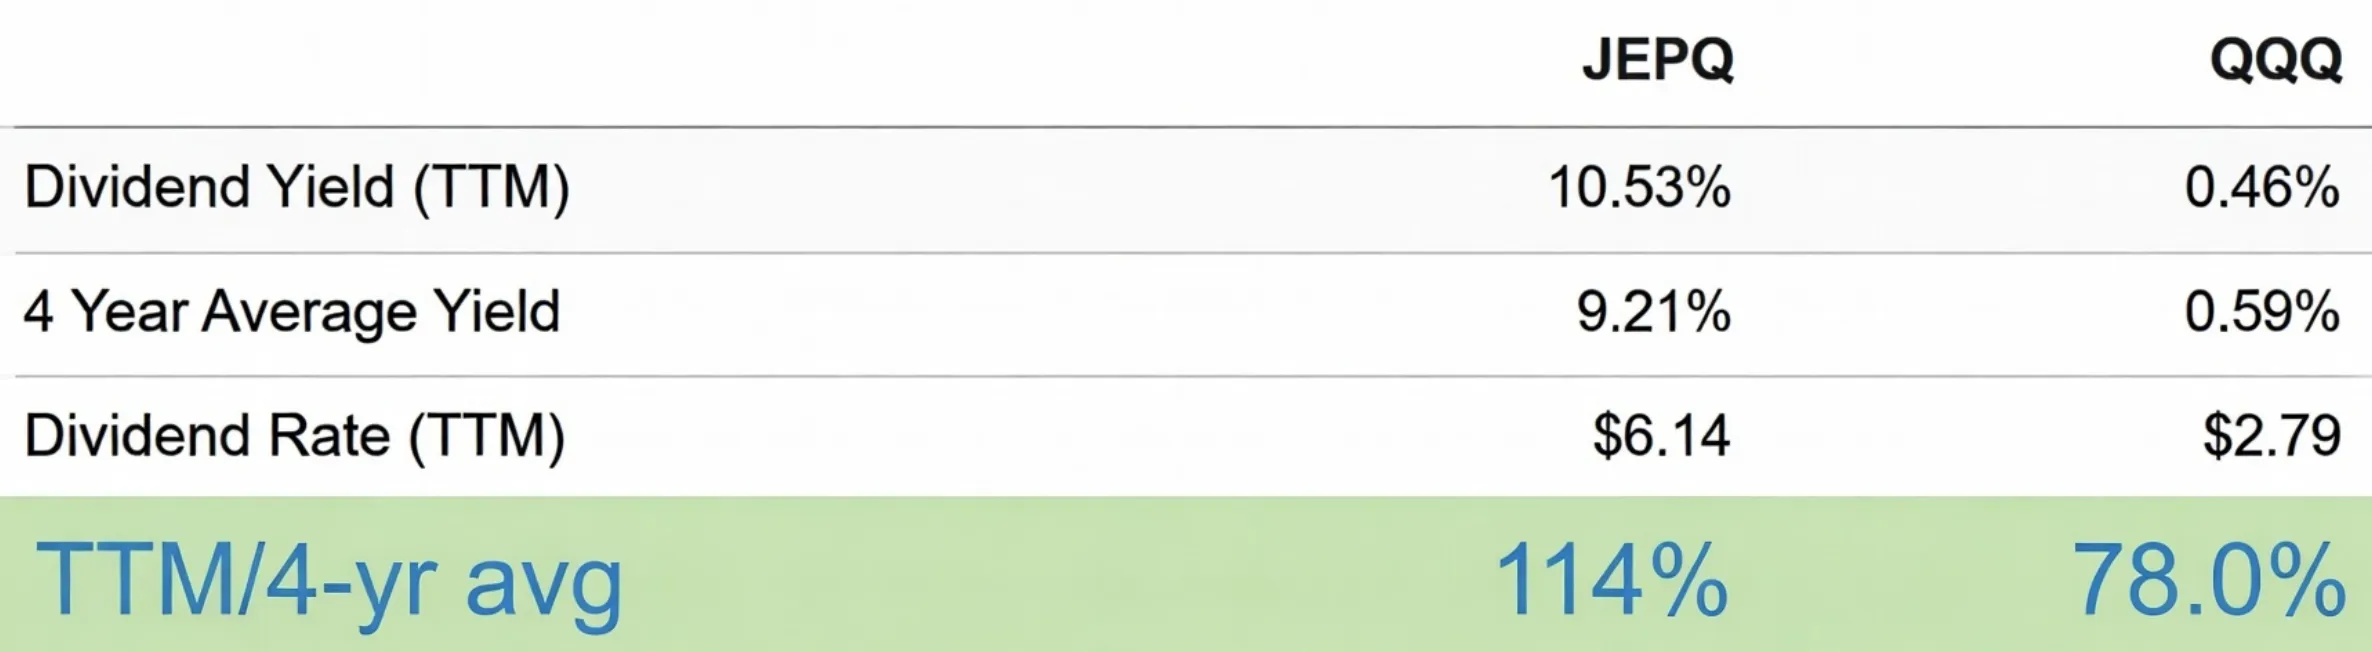
The yield is the headline. But yield alone doesn't justify the trade - context does. At 10.3% on a trailing basis, JEPQ is paying out roughly $0.49–$0.52 per month at current levels. That income isn't guaranteed - it rises with volatility and compresses when markets calm down. The yield comparison to QQQ's 0.46% is almost comical on its face, but the more instructive comparison is JEPQ's current yield versus its own history.
JEPQ's current yield sitting above its own 4-year average is a signal worth pausing on. It means either: (a) the current option premium environment is unusually rich, or (b) NAV has pulled back relative to earnings potential. In December 2025, both are partially true - NAV dipped from $60 highs to the $57 range, and volatility has been creeping up. The income investor's entry point is improving on two fronts simultaneously.
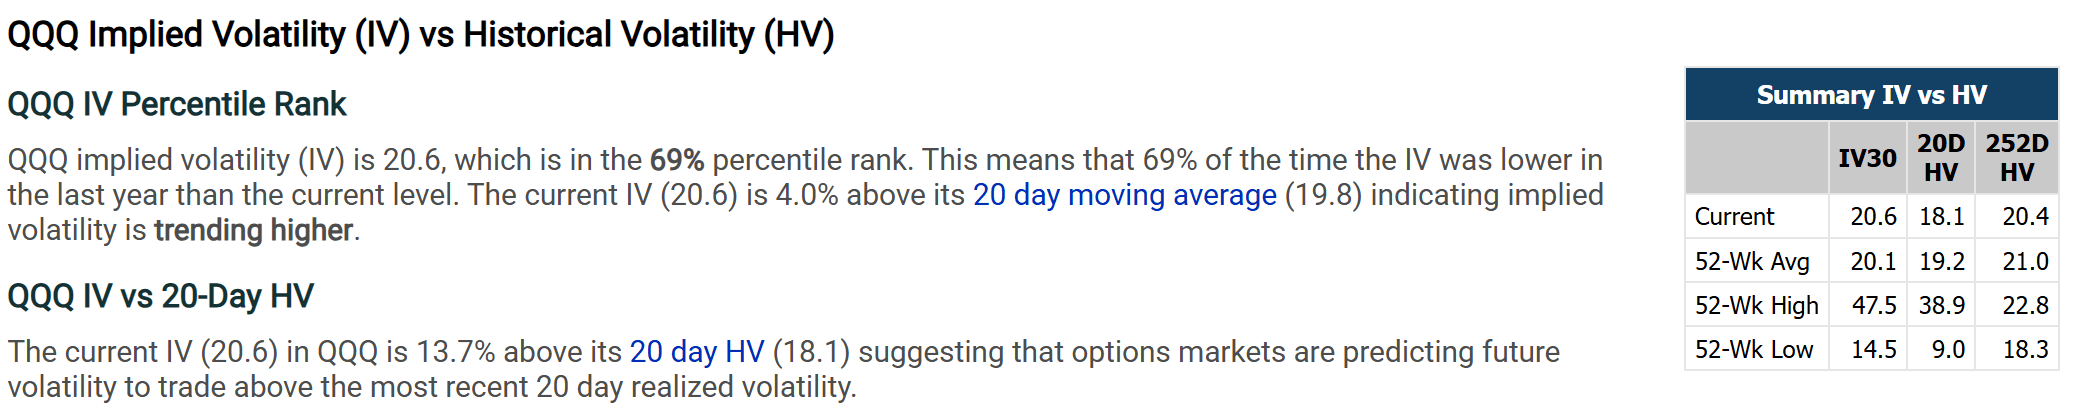
The IV30 data tells a specific story: we are not at the extreme volatility of April 2025's tariff shock (47.5), but we are also no longer in the compressed, post-summer calm. IV is trending upward from a base near 14.5 toward a range more consistent with JEPQ's historically richer distribution months. If IV continues rising into Q1 2026 - which the macro backdrop strongly suggests - JEPQ's monthly income should follow.
For an income ETF, the technical picture matters differently than it does for a growth stock. We are not trying to time a breakout or catch a momentum wave. We are looking for a setup where: (a) the price is above key trend support, confirming the underlying index is not in a structural breakdown, and (b) the entry is not at a frothy technical extreme, which would suggest the income yield is thinner than usual relative to risk. December 2025 checks both boxes.
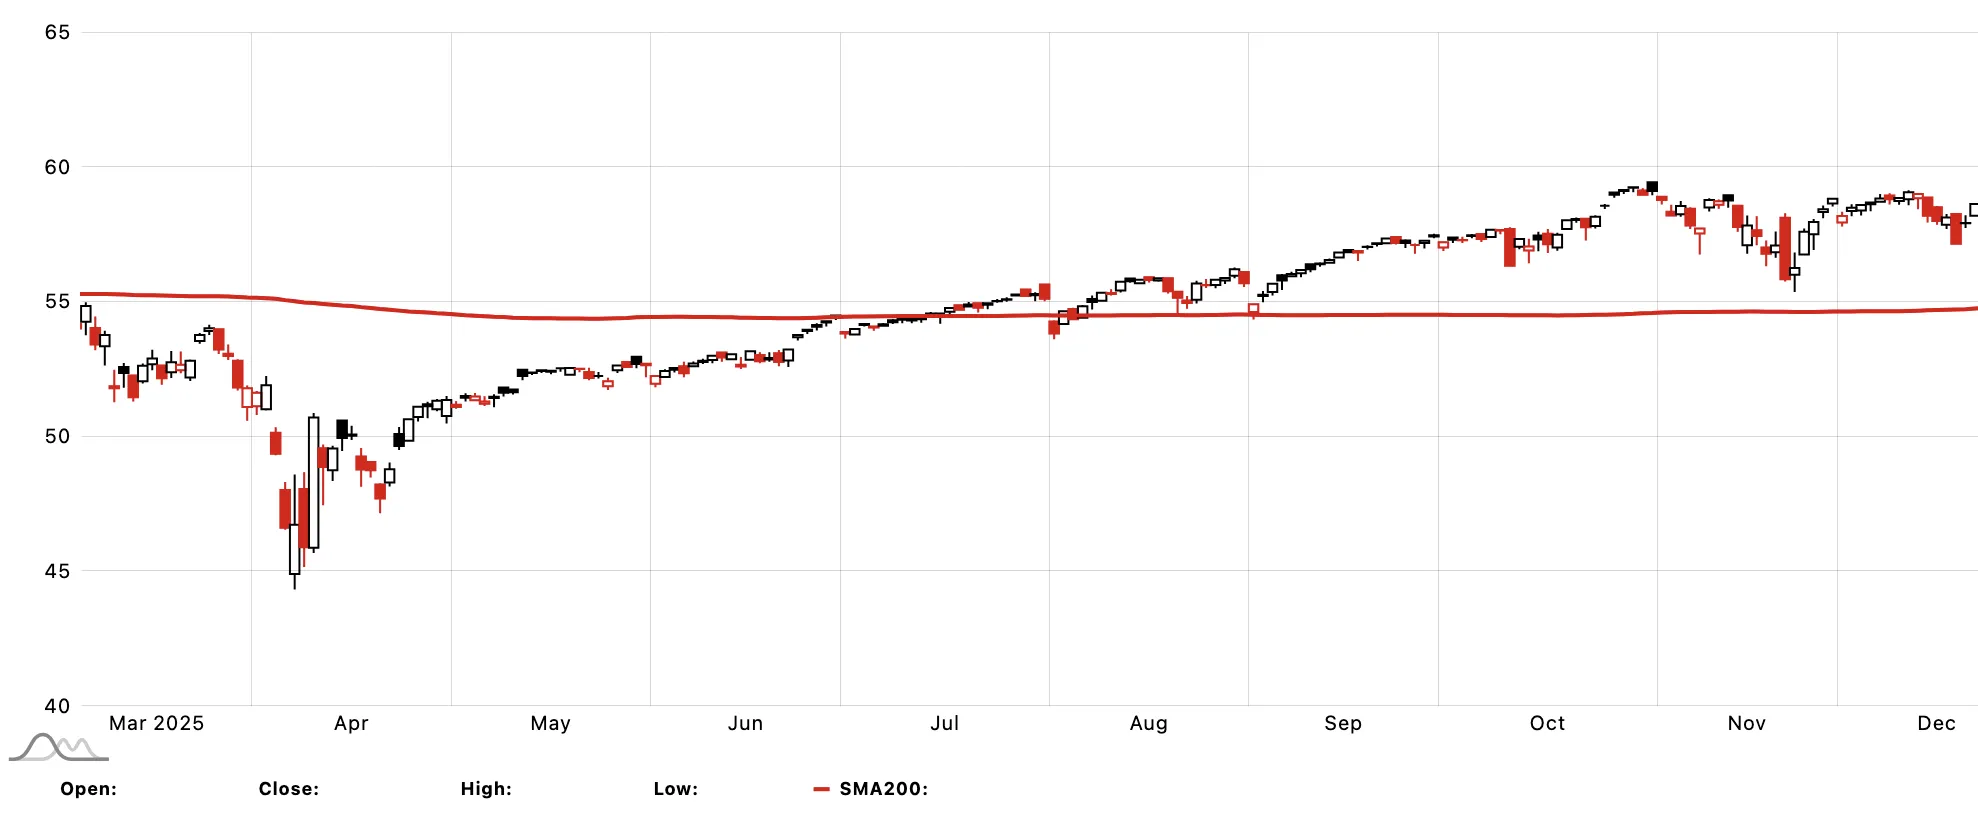
The chart tells a clear story. JEPQ bottomed with the broader market in April 2025 (~$44) during the tariff-driven sell-off, recovered steadily through the summer, and pushed to 52-week highs near $60 in late November. Since then, a modest pullback has brought the price back into the $56–$58 range - still well above the SMA200 near $55, which now acts as first support. That support is meaningful: if the SMA200 holds, we're entering a defined risk setup with downside to a known technical floor.
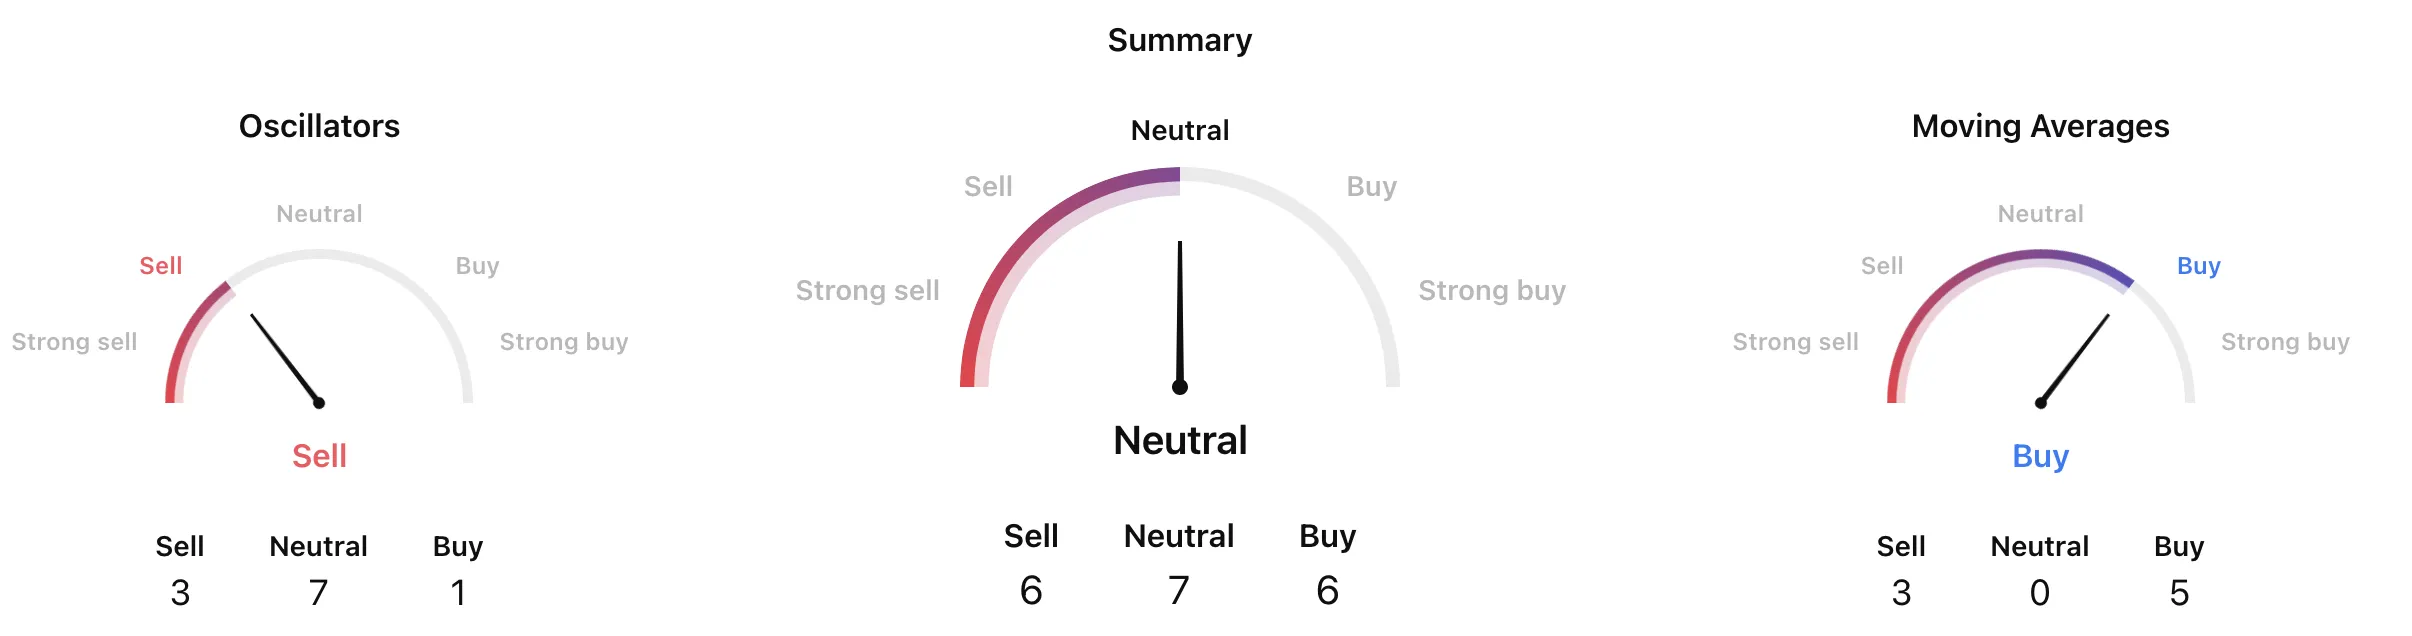
The gauge summary is the kind of mixed picture that income investors should actually welcome. Five of the key moving averages signal Buy - the medium and long-term trend is intact. The oscillators show three Sell readings and seven Neutral - the fund has cooled from its overbought highs near $60. That's not weakness; it's the entry point. An oscillator reset on top of a still-bullish MA stack is typically where the best risk-adjusted entries appear on any income instrument.
| Indicator | Signal | Interpretation for Income Entry |
|---|---|---|
| Moving Averages (5/8) | Buy | Medium/long-term trend intact. Underlying Nasdaq support holding. |
| Oscillators (3/11) | Sell-leaning | Short-term overbought from Nov rally has unwound. Classic reset before re-entry. |
| SMA200 proximity (~$55) | Supportive | $1–2 gap to SMA200 from entry. Defined risk floor for position sizing. |
| 52-Week Position (~$57 vs high $60) | Neutral | 5% below annual high. Yield-on-cost improves ~0.5pp vs buying at peak. |
Unlike a stock tip, the returns from JEPQ don't depend on a single event - they compound across 12 monthly distributions plus whatever NAV movement occurs. Three scenarios below model total returns over a 9–12 month hold from a $57 entry, accounting for income plus price movement under different Nasdaq outcomes.
| Scenario | Market Environment | NAV at Exit | 12-Month Income | Total Return |
|---|---|---|---|---|
|
▼ Bear
Nasdaq corrects 15–20%
|
AI capex bust narrative, rate hike, QQQ drops to ~$430 equivalent. JEPQ's 0.78 beta buffers some damage. | ~$50–$52 | ~$5.50 | approx. breakeven to −$1.50 Income nearly offsets NAV loss |
|
▶ Base
Choppy, range-bound 2026
|
Nasdaq oscillates ±8%, finishing roughly flat. Elevated VIX through Q1–Q2 keeps premiums rich. JEPQ outperforms QQQ on total return. | ~$58–$62 | ~$6.00 | +12–19% Income + modest NAV gain = $63–$68 equivalent total |
|
▲ Bull
Nasdaq grinds higher 10–15%
|
AI ROI materialises earlier than expected. Rate cuts resume. Nasdaq climbs but not in a straight line - choppiness still supports premiums. | ~$62–$66 | ~$6.20 | +19–27% Both NAV and income contribute. Target zone hit. |
The bear scenario shows what makes JEPQ genuinely interesting: even in a 15–20% Nasdaq correction, 12 months of income (~$5.50) offsets most of the NAV decline. An unhedged QQQ position in the same scenario would carry the full loss with only $0.26 in dividends. The asymmetry favours JEPQ whenever the range of outcomes is wide - and right now, the range of outcomes for the Nasdaq is about as wide as it's been in three years.
Every income strategy has a failure mode. JEPQ's are well-defined and worth naming plainly rather than burying in fine print.
The covered call cap is the primary structural constraint. If the Nasdaq delivers another 2023-style 50% bull run, JEPQ will lag significantly. Our base case is that this environment is less likely in 2026 given elevated valuations and CAPEX uncertainty - but it's the honest bear case for this thesis.
If the market enters a prolonged, low-vol, slow-grind higher, JEPQ's option premiums thin out and monthly distributions shrink. The 4-year average yield of 9.2% provides a floor estimate, but a compression to 8% from 10.3% would affect income-focused investors' return calculations meaningfully.
JEPQ's distributions from ELNs are classified as ordinary income - taxed at the holder's marginal rate, not the 15–20% qualified dividend rate. For investors in high tax brackets holding JEPQ in taxable accounts, the after-tax yield is materially lower than the headline 10.3%. This tip is better suited for tax-advantaged accounts (IRA, Roth).
At 0.35%, JEPQ's expense ratio is roughly 2x QQQ's 0.18%. Over a 10-year horizon, this compounds meaningfully. Over 9–12 months, the impact is minor - approximately 0.17% drag on total return. Worth noting for long-term holders; negligible for the trade timeframe proposed here.
The following scenarios reflect the author’s personal analysis and are not investment recommendations. See our full disclaimer.
Disclaimer: This market tip is published by PolyMarkets Research Team for educational and informational purposes only. It does not constitute financial advice, a solicitation, or a recommendation to buy or sell any securities. ETF investments involve risk, including possible loss of principal. Past performance and distributions are not indicative of future results. Distribution amounts may vary and are not guaranteed. Always conduct your own due diligence and consult a licensed financial advisor before making any investment decisions.