There is something genuinely strange happening with NVIDIA right now. On February 25th, the company reported what may be the most profitable quarter in the entire history of the semiconductor industry - $68.1 billion in quarterly revenue, $43 billion in net income, and forward guidance of $78 billion that beat Wall Street's consensus by $6 billion. The stock fell 5%.
I have been following semiconductors for over a decade, and I cannot recall a situation where the world's most dominant technology platform delivered results this extraordinary and was penalized for it. The sell-off is real. The logic behind it - sequential deceleration in quarter-over-quarter growth - is technically valid but, in my view, catastrophically misses the bigger picture.
What the market is struggling to price is that NVIDIA is no longer primarily a chip company. It has become the indispensable infrastructure layer of the entire global AI ecosystem. Every major language model, every sovereign AI initiative, every hyperscaler data centre runs on NVIDIA architecture. The company generated $97 billion in free cash flow for the full fiscal year - that is more than most S&P 500 companies generate in annual revenue. And the next chip generation, Vera Rubin, promises to reduce inference token costs by 10x, which virtually guarantees another upgrade cycle before the current Blackwell buildout is even complete.
The post-earnings dip has pushed the forward P/E below 27x - now below the Mag7 median of approximately 30x, representing the most significant valuation discount to NVIDIA's own recent history. The entry window is right in front of us.
Company & Q4 FY2026 Earnings
Business Model
NVIDIA operates as a fabless semiconductor designer - it designs the world's most advanced AI accelerator chips and full-stack computing platforms, then outsources fabrication to TSMC. Founded in 1993 by Jensen Huang, the company has undergone a structural transformation from a gaming graphics pioneer into the undisputed backbone of global AI infrastructure. Its CUDA software platform, developed over 15+ years, has created a developer ecosystem so deeply entrenched that even well-funded rivals cannot dislodge it in any near-term horizon.
Revenue Segments
Data Center now accounts for 91.5% of NVIDIA's total revenue. In Q4 FY2026 (quarter ending January 25, 2026), the segment generated $62.3 billion, up 75% year-over-year - driven by insatiable hyperscaler demand for Blackwell architecture GPUs, networking (NVLink, InfiniBand, Spectrum-X Ethernet) and the emergence of sovereign AI as a meaningful third category. Networking alone generated $11 billion in Q4 - a 263% year-over-year surge - and $31 billion for the full fiscal year, confirming that NVIDIA is being paid not just for chips but for entire AI factory infrastructure. Gaming contributed roughly $2.5 billion, Professional Visualization $0.51 billion, and Automotive $0.57 billion.
Why did the stock fall 5% on blockbuster results? Two reasons. First, sequential data center growth decelerated slightly - from +25% QoQ in Q3 to +22% QoQ in Q4, with Q1 guidance implying ~15% QoQ. Second, NVIDIA began including stock-based compensation ($1.9B) in its non-GAAP operating expense guidance, which made cost growth look alarming on first read. Neither signals a fundamental deterioration. The underlying demand is accelerating on a year-over-year basis (+77% guided for Q1). This is a market misread, and in my experience, those create the best entries.
Full-Stack Platform - Not Just a Chip Company
NVIDIA's competitive moat is multi-layered: GPU hardware (Hopper, Blackwell, Blackwell Ultra, Vera Rubin), CUDA developer ecosystem (millions of programmers), AI Enterprise software, NVLink chip-to-chip interconnects, InfiniBand and Spectrum-X networking, and Omniverse for simulation. When a hyperscaler buys NVIDIA, they are buying an entire AI factory system - not individual chips. This full-stack lock-in is why no alternative has made a material dent in NVIDIA's dominant market share.
What's Priced In vs. What Isn't
The post-earnings sell-off is telling us what the market fears. The analysis below breaks those fears apart from the underlying reality - because the gap between the two is precisely where the investment case lives.
Risk Q&A - The Bear Case, Honestly Answered
Context Before the Questions
NVIDIA carries a beta of approximately 2.3, meaning it moves more than twice as sharply as the broad market. The stock has experienced 20–35% drawdowns within secular uptrends - and will likely do so again. The risks below are genuine, not dismissible. Investors need to size positions accordingly and make peace with volatility before entering.
Future Outlook & The Architecture Roadmap
The Architecture Ladder
NVIDIA's annual chip generation cadence is one of the most powerful structural advantages in technology. Each generation doesn't just outperform the previous - it transforms the economic calculus for every AI operator on the planet.
Hyperscaler Capital Expenditure - The Demand Floor
The easiest way to validate the AI buildout thesis is to read the CapEx commitments from the companies writing NVIDIA's cheques:
| Company | 2024 CapEx | 2025 CapEx | 2026 Guided | YoY Growth |
|---|---|---|---|---|
| Amazon (AWS) | $75B | $103B | ~$200B | +94% |
| Microsoft (Azure) | $55B | $80B | ~$185B | +131% |
| Alphabet (Google) | $52B | $75B | ~$75B | +0% |
| Meta Platforms | $38B | $40B | ~$65B | +63% |
| Total (Big 4) | $220B | $298B | ~$525B | +76% |
| TSMC (manufacturing) | $30B | $38B | $52-56B | +37-47% |
Path to $1 Trillion AI Chip Market
According to Futurum Research, the global AI chip market is projected to reach $1 trillion by 2030, with NVIDIA capturing 60–65% (~$600–650 billion). The consensus analyst revenue estimates for NVIDIA reflect this trajectory: approximately $259 billion in FY2027 (ending Jan 2027), scaling toward $360–551 billion by FY2028–2029. NVIDIA's management explicitly noted they expect to exceed the previously announced $500 billion Blackwell + Rubin revenue opportunity shared with investors last year. That commitment now extends into calendar 2027.
Competitor & Valuation Analysis
NVIDIA's competitive landscape spans traditional GPU peers (AMD), custom ASIC designers (Broadcom), and its own hyperscaler customers who are building in-house silicon. Despite noise around each category, NVIDIA has maintained dominant market share through every chip generation transition. The more interesting question today is not whether competition exists - it does - but whether the market is pricing NVIDIA correctly given its growth rate.
| Company | Market Cap | AI Revenue | Key Advantage | Key Weakness |
|---|---|---|---|---|
| NVIDIA (NVDA) | ~$4.5T | $216B (FY) | CUDA + full-stack AI factory platform | TSMC dependency, China blocked |
| Broadcom (AVGO) | ~$1.5T | $20B AI FY25 | Custom ASICs - lower cost for defined workloads | Long design cycles, no software ecosystem |
| AMD (AMD) | ~$300B | $16.6B DC FY25 | CPU+GPU combo, OpenAI MI450 deal | ROCm far behind CUDA; single-digit AI GPU share |
| Intel (INTC) | ~$200B | Negligible AI | Own manufacturing (Intel Foundry) | <1% AI accelerator share; foundry losses |
The Valuation Disconnect - NVDA vs. Magnificent Seven
Perhaps the most compelling data point in this entire analysis: after the post-earnings sell-off, NVIDIA is trading at a discount to the sector median forward P/E - and at its steepest discount to NVIDIA's own recent valuation history. On a PEG basis, at 0.66x, it is the best-valued name in the Mag7 relative to its growth rate:
Sector median forward P/E: ~29.6×. PEG = Forward P/E ÷ Expected 5-year EPS growth rate. Source: Seeking Alpha, company filings, author calculations. Data as of Feb 28, 2026.
NVIDIA is expected to grow EPS by 58% over the next two fiscal years - the highest growth rate in the Magnificent Seven - yet trades at 22.4× this year's earnings and 14.1× FY2027 estimates. For comparison, Walmart and Costco trade at double NVIDIA's forward multiple with a fraction of the earnings growth. The valuation does not match the growth profile by any standard measure.
Technical Analysis
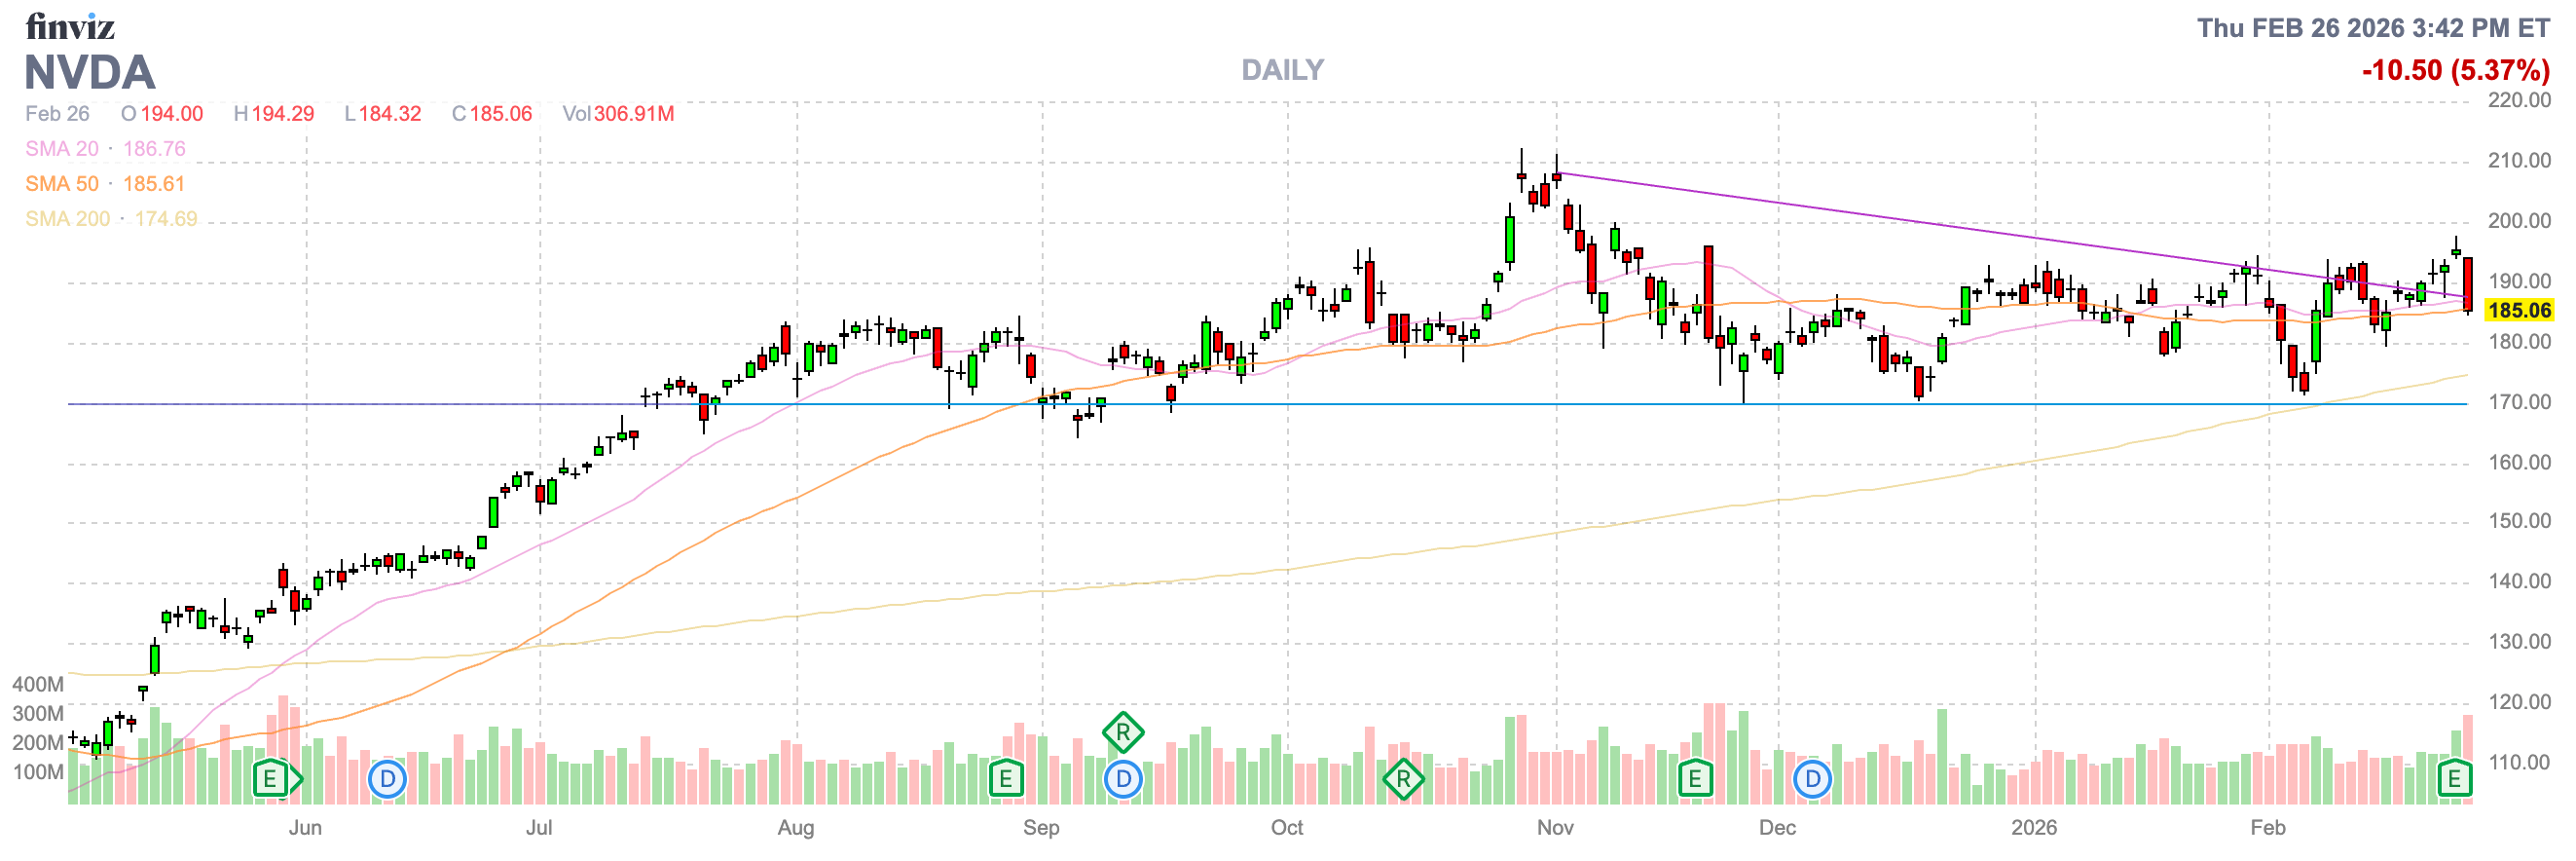
The chart below shows NVIDIA's daily price action through February 26, 2026 - the session immediately following the Q4 earnings report. The post-earnings drop of 5.37% is visible as the final large red candle, landing the stock squarely on its 50-day SMA.
Technical Interpretation
The chart tells a story of a stock that has been consolidating - trading sideways to slightly lower - since peaking near $210 in October/November 2025. A descending resistance trendline is clearly visible connecting the successive lower highs, and NVIDIA has failed to break above it on multiple attempts. The post-earnings gap down has now placed the stock precisely at the 50-day SMA ($185.61), a level that has historically acted as dynamic support during NVIDIA's secular uptrend.
Crucially, the 200-day SMA sits at $174.69 - approximately 6% below current levels - and represents the ultimate floor for a long-term entry accumulation strategy. The horizontal blue support line visible around $170 aligns with both the 200-day SMA and a prior consolidation base from mid-2025. A test of this level would represent a meaningful technical pullback but would not break the long-term uptrend structure.
Volume on the earnings session - 306.91 million shares - is elevated but not extreme panic selling, suggesting institutional buyers were absorbing supply rather than fleeing en masse. This is a constructive sign for the thesis that the sell-off is a mispricing rather than a trend change.
A break above the descending trendline resistance (currently ~$190–192) on volume would signal that the consolidation phase is complete and initiate the next leg toward the $205–210 zone. Beyond that, clear air exists toward analyst price targets in the $250–255 range, supported by FY2027 earnings estimates and the anticipated re-rating as Vera Rubin production shipments begin.
Investment Strategy
The following scenarios reflect the author’s personal analysis and are not investment recommendations. See our full disclaimer.
Three Scenarios by December 2026
Action Plan
- Entry - Tranche 1 ($183–$186): Initiate a 40% position at current levels, anchored to the 50-day SMA. This is where the stock is now after earnings. The SMA has held through multiple prior tests.
- Entry - Tranche 2 ($174–$178): Add a second 40% tranche near the 200-day SMA if the market offers a further pullback. A technical retest of this level is a textbook accumulation opportunity.
- Entry - Tranche 3 ($160–$165): Reserve 20% for a worst-case flush toward the prior breakout zone. Size the overall position to survive this scenario without forced selling.
- Thesis Invalidation Level ($158): A weekly close below $158 would break the 200-day SMA with material buffer and suggest the bull thesis is compromised. Below this level the thesis no longer holds - reassess rather than averaging into a broken chart.
- Upside Scenario Plan: Trim 25% at $205 (trendline break confirmation), 25% at $230 (FY2027 earnings re-rating), and allow the remaining 50% to compound toward $255+ with a trailing stop as Vera Rubin production ramp validates the thesis.
- Position Sizing: Given NVIDIA's beta of ~2.3, limit the total position to 3–5% of a diversified portfolio. This is a high-conviction idea with a wide range of outcomes - size accordingly.
- Monitoring: Key events to watch: Q1 FY2027 earnings (late May 2026), Vera Rubin production shipment confirmation, hyperscaler Q2 2026 CapEx commentary, and any development in U.S.–China export policy. Jensen Huang's GTC keynote (March/April 2026) will also be critical for Rubin architecture details.
Important Disclaimer
This content is for informational and educational purposes only and does not constitute financial advice, investment recommendations, or solicitation to buy or sell any securities. Past performance does not guarantee future results. All investments carry risk, including loss of principal. NVIDIA stock involves significant volatility risk given its high beta. Always conduct your own research and consult a qualified financial advisor before making investment decisions. The authors and publishers are not responsible for any financial losses resulting from the use of this information. Analysis updated February 28, 2026, incorporating Q4 FY2026 earnings data.