Company Overview
Key Facts - November 20, 2025
ZIM: The Agile Challenger in a Consolidating Industry
ZIM Integrated Shipping Services Ltd. (NYSE: ZIM) is one of the world's top-15 container shipping carriers, founded in 1945 and headquartered in Haifa, Israel. Unlike the ultra-large global alliances (Maersk, MSC, CMA CGM), ZIM has built its competitive identity around agility - the ability to redeploy capacity, adjust trade lane exposure, and capitalise on freight rate volatility faster than peers locked into rigid alliance structures. This agility strategy, combined with a transformative fleet modernisation programme completed in 2023–2024, defines ZIM's investment case for the November 2025 entry.
ZIM operates across the world's major container trade lanes with particular strength on the Transpacific (Asia–US West and East Coast), Latin America, and increasingly Southeast Asia. Beyond dry containers, ZIM has built a differentiated Refrigerated Cargo business serving perishable goods - fruits, vegetables, and pharmaceuticals - which command premium freight rates and provide margin resilience during dry-cargo rate troughs. ZIM also operates the eZ Quote digital platform for instant freight quotes, vessel capacity monitoring, and online bookings - an operational differentiator supporting customer retention and real-time cargo management. The company went public on the New York Stock Exchange in January 2021, raising approximately $204 million net - and has since returned approximately $5.7 billion in dividends, representing more than 25 times the IPO raise, to shareholders. This extraordinary capital return history, largely unmatched in the sector, is central to understanding ZIM's equity value proposition at a time when the stock trades at near-liquidation multiples.
The investment setup on November 20, 2025 is specific: ZIM is reporting Q3 2025 earnings on the same day as this tip, with results that demonstrate continued profitability and a raised full-year guidance midpoint in a challenging freight environment. The stock has been compressed by a combination of rate normalisation fears, anticipated Q4 weakness, and Suez Canal reopening concerns - all of which are either already priced in or misunderstood by the market. At $15.50–$17.00, ZIM trades at approximately 1x its own 2025 annual EBITDA guidance, a valuation level that historically has marked a floor for profitable, dividend-paying shipping companies with modern fleets and strong balance sheets.
The Fleet Transformation: From Liability to Structural Advantage
ZIM's most important strategic achievement of the 2021–2025 period is its fleet transformation. Between 2023 and early 2025, the company took delivery of 46 purpose-built newbuild vessels - larger, more fuel-efficient, and critically equipped with LNG dual-fuel propulsion. This fleet investment, secured on long-term charter contracts of 5–12 years with major vessel owners, solved two structural vulnerabilities that characterised pre-IPO ZIM: dependence on an expensive spot charter market for tonnage, and an older, less competitive fleet profile.
As of November 2025, ZIM operates a total of 129 vessels - 115 containerships totalling 709,000 TEUs and 14 car carriers (all chartered). Of the 115 containerships, 16 are owned by ZIM and 99 are chartered. Per ZIM's Q3 2025 Investor Presentation, the fleet is composed of approximately ~60% newbuild vessels and ~40% LNG-powered capacity (by TEU) - a fleet breakdown that gives ZIM the youngest, most fuel-efficient profile in its competitive tier. The asset-light model - whereby ZIM charters approximately 94% of its operated fleet - provides structural flexibility to reduce capacity quickly as older charter contracts expire, without the capital destruction of disposing of owned vessels. YTD 2025 alone, ZIM has already redelivered 22 chartered vessels, actively managing its cost base downward.
The long-term LNG newbuilds are locked in at contractual charter rates providing cost predictability for 5–12 years. This structure gives ZIM a lower-cost, more predictable base than at any point in its history, while retaining the operational flexibility that is its commercial trademark.
Critically, ~40% of ZIM's operated capacity is LNG-powered - the largest proportion in its fleet segment. LNG dual-fuel vessels reduce fuel costs, lower carbon emissions, and are increasingly preferred by major shippers with decarbonisation commitments. This positions ZIM ahead of forthcoming IMO emissions regulations and gives it a commercial differentiation advantage when winning logistics contracts from ESG-conscious corporates.
Understanding ZIM's Valuation Anomaly - November 2025
At an entry midpoint of $16.25 and approximately 119 million shares outstanding, ZIM's market capitalisation is approximately $1.93 billion. The company's FY2025 EBITDA guidance is $2.0B–$2.2B - meaning the stock is trading at roughly 0.9× its own annual EBITDA. The total equity (book value) stands at $4.02 billion as of September 30, 2025 - so ZIM trades at just 0.48× book value. For a company that is generating cash (97% cash conversion rate, $574M free cash flow in Q3 alone), this is a valuation anomaly rarely seen outside of imminent bankruptcy scenarios. ZIM is not bankrupt - it holds $3.01 billion in liquidity and has a net leverage ratio of just 0.9×.
The core question is not whether ZIM is cheap - at these multiples, it demonstrably is. The question is whether the market's fears about 2026 rate deterioration are sufficient to justify pricing the company at liquidation value. Our analysis suggests they are not, and that three specific near-term catalysts - Suez Canal reopening efficiency gains, US-China trade recovery, and potential corporate activity - can re-rate the stock to the $23–$25 zone within 3–6 months.
Q3 2025 Earnings - The Setup
Margin Resilience Despite Sharp Rate Normalisation
Q3 2025 revenue down 36% YoY as freight rates normalised from exceptionally elevated 2024 levels - EBITDA margin of 33% demonstrates the structural efficiency of ZIM's asset-light model.
ZIM reports Q3 2025 results on November 20, 2025 - the same day as this tip. The headline numbers confirm continued profitability well above what the current stock price implies:
Q3 2025 Key Financial Results
Revenue: $1.777 billion - down 36% year-over-year, reflecting lower freight rates vs. the exceptional 2024 environment, but consistent with Q3 guidance issued in August.
Adjusted EBITDA: $593 million - EBITDA margin of 33%, demonstrating that cost discipline and fleet efficiency are protecting margins even as rates normalise.
Adjusted EBIT: $260 million - EBIT margin of 15%, highlighting the earnings power of the modernised fleet at current rate levels.
Net Income: $123 million - positive and sufficient to trigger the quarterly dividend policy (30% payout).
Cash Flow from Operations: $628 million - reflecting the business's continued ability to convert earnings to cash at a 97% rate; Free Cash Flow: $574 million after capex.
Dividend Declared: $0.31 per share - $37 million total; total cumulative dividends since IPO now reach approximately $5.7 billion / $47.54 per share.
Total Liquidity: $3.01 billion (at September 30, 2025) - Total Equity: $4.02 billion; Net Debt: $2.642 billion; Net Leverage Ratio: 0.9× - an exceptionally strong balance sheet for a company trading at ~$1.9B market cap.
FY2025 Guidance (Raised Midpoint): Adjusted EBITDA $2.0B–$2.2B / Adjusted EBIT $700M–$900M - the lower end was raised by $200M from prior guidance (August: $1.8B–$2.2B / $550M–$950M), confirming the year-to-date performance is ahead of August projections.
The market's focus will gravitate to the CEO's explicit acknowledgement that Q4 is "trending weaker than originally projected." This is already known and partially priced in - the stock's depression to the $15–$17 range in the weeks leading up to earnings reflects this expectation. What is less well appreciated is that the Q3 results confirm the full-year EBITDA floor of $2.0 billion, that liquidity remains ample at $3B, and that ZIM's management has a demonstrated pattern of under-promising and over-delivering on guidance - the lower end raise of $200M in Q3 follows a similar pattern from H1.
Financial Progression - H1 2025 vs. H2 Context
Q1 2025: Revenue ~$2.0B, Adjusted EBITDA ~$779M (derived: 9M total $1,844M minus Q3 $593M minus Q2 $472M)
Q2 2025: Revenue $1.64B, Adjusted EBITDA $472M, Net Income $24M - weakest quarter due to tariff-driven Transpacific disruption
Q3 2025: Revenue $1.777B, Adjusted EBITDA $593M, Net Income $123M - sequential recovery; Transpacific volume up 17% QoQ
Q4 2025 (implied by guidance): FY guidance $2.0B–$2.2B minus 9M EBITDA $1,844M = Q4 implied range of $156M–$356M - directionally reduced NI, consistent with management's "weaker than projected" commentary
9-Month 2025 Revenue: $5.419 billion - down 13% year-over-year. The decline is real but the business remains firmly profitable and cash-generative. Free cash flow for the 9 months reached $1.787 billion, reflecting a 97% cash conversion rate.
Volume Trends: Diversification Working
ZIM carried 926,000 TEUs in Q3 2025 - down 5% year-over-year but up sequentially from Q2. Crucially, 9-month 2025 total volume of 2,765,000 TEUs is essentially flat (-0.1%) versus the same period in 2024 - meaning ZIM's underlying cargo franchise is holding firm even through one of the most disruptive tariff periods in recent history. The volume picture is nuanced: the year-over-year decline reflects weaker Cross-Suez and Atlantic activity due to the Cape of Good Hope rerouting, while Transpacific volumes held remarkably well - down just slightly year-over-year despite the US-China trade tensions, and up 17% sequentially as tariff-related disruption from April–May normalised.
The geographic volume breakdown from ZIM's official investor presentation reveals the strategic diversification in action: on a 9-month basis, Latin America surged +19% year-over-year (to 414K TEUs) and Intra-Asia grew +11% (to 411K TEUs) - the two growth markets ZIM has been strategically targeting. The Atlantic trade also grew +23% in Q3 year-over-year (113K vs. 92K TEUs). These growth lanes are directly offsetting the Cross-Suez shortfall caused by the Red Sea closure, and will compound positively when the Suez reopening adds the route-efficiency benefit on top of volume recovery.
The average freight rate in Q3 was $1,602 per TEU (-35% year-over-year), with the 9-month average at $1,622/TEU (-14%). However, compared to ZIM's own cost base improvement from its newbuild deliveries (average vessel size up 50% since 2022), the EBITDA margin of 33% is a testament to how significantly fleet modernisation has lowered the breakeven freight rate required to generate positive returns.
Key Catalysts
Catalyst 1 - Suez Canal Reopening: Cost Savings and Strategic Opportunity
The most significant near-term catalyst for ZIM is the anticipated reopening of the Suez Canal to commercial shipping. CEO Eli Glickman stated on the Q3 2025 call: "We believe that the return to the Suez Canal in the near future now appears increasingly likely. Therefore, we are preparing an operational plan to support this transition once the security situation has stabilised." ZIM is awaiting approval from vessel owners and insurance companies - the final procedural steps before resuming Suez transit.
For ZIM specifically, the Suez Canal return carries a net positive economic profile. Shorter routes reduce fuel consumption - material for a company with 709,000 TEUs of operated capacity at current bunker prices. Fleet efficiency improves as vessel transit times shorten and the same ships can complete more voyages per year. For ZIM's core Transpacific business, the Suez return has limited direct capacity impact (Transpacific ships don't use Suez), meaning ZIM is less exposed to the industry-wide capacity increase the reopening will create compared to peers heavily weighted toward Asia-Europe trade.
The CEO also identified the Suez reopening as a market share opportunity: asked whether ZIM would expand its Asia-Europe presence, the answer was unambiguous: "Yes." A carrier entering a previously avoided trade lane with a modern, LNG-powered fleet at a time when rates are depressed and competition needs time to reorganise is well-positioned to gain profitable contract positions.
Catalyst 2 - US-China Trade Agreement: Transpacific Demand Recovery
The Q3 2025 earnings call coincides with a recently announced US-China trade agreement that the CEO described as "a positive development, potentially reducing market uncertainty and enabling our customers to plan with greater confidence." The 90-day tariff suspension of May 2025 - which drove a sharp Transpacific demand spike - demonstrated that pent-up demand exists in the US-China trade lane when tariff barriers are reduced. A more durable agreement with permanently reduced tariffs (compared to the peak 145% level reached in April 2025) could support a meaningful recovery in Transpacific cargo volumes in Q1–Q2 2026.
ZIM's Transpacific franchise is its largest revenue contributor. In Q3, Transpacific volumes were down only 1.5% year-over-year despite one of the most disruptive tariff periods in recent history - a demonstration of ZIM's entrenched customer relationships on this trade lane. Even a partial restoration of China-to-US cargo flows would have a material positive impact on ZIM's Q1–Q2 2026 volumes and freight rates.
Catalyst 3 - Potential Management Buyout (MBO)
One of the most unusual elements of the Q3 2025 earnings call was the public discussion of a potential management buyout. When asked directly, CEO Glickman responded: "For this, we have no comment. For sure, the Board will decide when and how - no comment for this question." This response - neither confirming nor denying - leaves open the possibility that an MBO is under active exploration. Simultaneously, ZIM disclosed that two Board members resigned and were replaced with "two new highly professional Board members."
An MBO of ZIM at current market prices would represent extraordinary value for any acquirer. A company generating $2B+ in EBITDA, holding $3B in liquidity, and trading at a sub-$2B market cap presents a compelling leveraged buyout target - the cash on the balance sheet alone almost covers the entire market cap. Market sources have cited a potential MBO price in the range of ~$20/share (unconfirmed) - which, from the $15.50–$17.00 entry zone, represents a 20–29% premium. While the MBO alone does not close the entire gap to the $23–$25 target, it would function as a floor mechanism: if confirmed, the stock would re-price immediately to the $20 range and remove downside risk, providing a platform from which the Transpacific and Suez Canal catalysts could drive further appreciation. This is an asymmetric optionality catalyst: it is not the primary thesis driver, but if it materialises, it eliminates the stop-loss risk and accelerates the timeline.
Catalyst 4 - Deep Value Re-Rating: ~1x EBITDA Cannot Persist
Markets occasionally misprice cyclical businesses at the trough of a cycle by extrapolating current conditions indefinitely. At $16.25 entry midpoint and approximately 119 million shares outstanding, ZIM's market cap is approximately $1.93 billion. Against FY2025 EBITDA guidance of $2.0B–$2.2B, the stock trades at 0.9× EBITDA. The company holds $3.0 billion in liquid assets - meaning the enterprise value (EV), adjusted for net cash, is effectively near zero or negative on a normalised basis.
The valuation is extreme across all metrics: forward P/E of approximately 5.83× and a price-to-book (P/B) of approximately 0.51× against total equity of $4.02 billion - meaning shareholders are buying $4.02 billion in equity book value for approximately $1.93 billion. Historically, profitable shipping carriers with modern fleets and strong liquidity do not trade sustainably below 1.0× book value. A reversion to just 1.0× book - not a premium, simply par - places fair value at approximately $34/share.
Additionally, short interest exceeds 17% of ZIM's float - a significant short position that creates a powerful technical amplifier. If any of the catalysts (Suez reopening, trade deal volume recovery, MBO news) triggers a rally, forced short covering adds momentum to the fundamental buying. The February 2025 ZIM rally from $6 to $20+ demonstrated exactly this dynamic when short sellers were caught on the wrong side of a freight rate surprise.
For context: Hapag-Lloyd and Maersk historically trade at 4–6× through-cycle EBITDA. Even at a deeply discounted 2× EBITDA trough multiple - already pricing in a severe 2026 rate deterioration - ZIM's fair value would be approximately $35/share. The $23–$25 target zone represents a conservative 1.0–1.1× EBITDA multiple on 2025 guidance: not a recovery to mid-cycle multiples, but simply a recognition that the business is worth more than its cash and receivables.
Catalyst 5 - 2026 Fleet Optionality and Cost Reduction
ZIM's CFO Xavier Destriau confirmed on the Q3 call that the company intends to continue redelivering short-term chartered vessels as they expire in 2026. Per ZIM's official fleet schedule, 17 vessels representing approximately 55,000 TEUs are up for renewal in 2026 - following the 22 vessels already redelivered YTD 2025 plus 3 additional in Q4 (5,600 TEU). This disciplined capacity management will reduce operating costs as older, less fuel-efficient vessels leave the fleet, further lowering ZIM's cost per TEU. Meanwhile, the company has already committed to 10 new 11,500 TEU LNG dual-fuel vessels for delivery in 2027–2028, with 12-year charter terms and purchase options - demonstrating management's long-term confidence while maintaining cost discipline in the near term.
The combination of a shrinking, more efficient core fleet in 2025–2026 and a growing, greener fleet in 2027–2028 positions ZIM for margin recovery as and when freight rates stabilise. The capacity reduction also signals to the market that management is prioritising profitability over market share - the correct strategic posture in a supply-heavy environment.
Catalyst 6 - Capital Returns: Year-End Dividend Catch-Up (March 2026)
ZIM's dividend policy distributes 30% of quarterly net income each quarter, with a year-end adjustment up to 50% of full-year net income, paid in March following year-end results. Despite a challenging year, the company has generated approximately $147 million in 9-month net income ($123M in Q3 + $24M in Q2 + near-zero in Q1), with the year-end catch-up payment calculated against the full 50% of annual net income. Even with a modestly negative Q4, the March 2026 annual dividend top-up could represent meaningful yield at current entry prices. The Board also retains discretion to declare special dividends - something it has done twice since IPO, including in December 2024. ZIM's extraordinary dividend track record ($47.54/share since IPO against a current share price of ~$16) underscores the Board's commitment to capital returns, and any positive surprise here at current prices would be highly impactful.
Strengths & Weaknesses
Strengths
- Trading at ~1x FY2025 EBITDA guidance - an extreme value discount that historically marks a floor for profitable shipping companies with modern fleets
- $3 billion in total liquidity (Sept 30, 2025) - nearly equivalent to the entire market cap at entry; no near-term financing risk
- 46 purpose-built newbuild vessels (2023–2024 deliveries) representing the youngest, most fuel-efficient fleet in ZIM's history; average vessel size up 50% since 2022
- 40% of operated capacity is LNG dual-fuel - industry-leading sustainability position generating commercial differentiation and fuel cost savings
- Exceptional capital return history: $47.54/share in cumulative dividends since January 2021 IPO - more than 25× the net IPO raise and approximately 3× the current share price
- Agile commercial strategy and fleet deployment - demonstrated ability to rapidly redeploy vessels across trade lanes in response to tariff disruptions, rate changes, and alliance shifts
- Strategic partnership with MSC (February 2025) providing cost synergies and capacity optimisation without the rigidity of a full alliance commitment
- Growing Latin America franchise: +19% 9-month volume growth in 2025 (to 414K TEUs) and strong Intra-Asia growth (+11%) - structural diversification away from US-China dependency actively working
- Exceptional cash generation: 97% cash conversion rate; $574M free cash flow in Q3 alone and $1.787B in 9M 2025 - the business converts profits to cash with near-perfect efficiency
Weaknesses
- Revenue and profitability highly correlated to freight rates: Q3 2025 rate of $1,602/TEU vs. $2,480/TEU in Q3 2024 reflects how quickly revenue can compress in a normalising cycle
- Transpacific trade concentration: significant exposure to US-China cargo flows makes ZIM vulnerable to geopolitical and tariff shocks in this bilateral relationship
- Q4 2025 will likely generate a net loss - dividend payments will be suspended for Q4, removing an income support for the stock in the near term
- Supply-side headwinds: global container orderbook stands at 31% of current fleet, with record deliveries expected again in 2027 - structural rate pressure could persist beyond 2026
- Smaller scale than the mega-carriers (Maersk, MSC, CMA CGM): limited pricing power relative to the top three, and access to fewer alliance benefits and joint service agreements
Opportunities
- Suez Canal reopening: shorter routes improve fleet efficiency, reduce fuel costs, and open Asia-Europe trade lane entry opportunity for ZIM with its modern, LNG-powered fleet
- US-China trade normalisation: a durable tariff reduction agreement could restore significant Transpacific cargo volumes suppressed since April 2025
- Management buyout (MBO): Board-level changes and management's explicit "no comment" on the MBO question suggests potential corporate action that could crystallise value well above current market prices
- Southeast Asia manufacturing shift: Vietnam, Thailand, Korea increasing US export share as manufacturers diversify from China - ZIM's expanded Southeast Asia network is directly positioned to capture this structural trade rerouting
- Vessel scrapping cycle: historically minimal scrapping for 5+ years cannot persist indefinitely; an acceleration in retirement of aging vessels (pre-2010 tonnage) would reduce effective supply and stabilise freight rates
- LNG cost advantage: as fuel prices and carbon regulations evolve, ZIM's 40% LNG fleet offers a structural cost and regulatory advantage over peers still operating predominantly on LSFO
Threats
- Suez Canal reopening increases effective industry capacity - the same route-length reduction that benefits ZIM's costs also brings back supply previously absorbed by longer Cape of Good Hope voyages, adding pressure to already-soft freight rates
- Record order book deliveries: 3+ million TEUs of new capacity expected in 2027, potentially re-creating the supply overhang conditions of 2023–2024
- US-China trade decoupling: despite the November 2025 trade agreement, both countries are structurally motivated to reduce bilateral dependence - the long-term Transpacific trade lane may contract even as near-term volumes recover
- Global economic slowdown: a recession in the US or Europe would reduce consumer demand for imports, compressing container volumes and freight rates simultaneously
- MBO speculation resolution: if the MBO rumour is definitively denied or abandoned, speculative premium built into the stock could unwind, creating short-term selling pressure
Risk Areas
Key Risk Factors
ZIM carries a Medium-High Risk designation. Container shipping is an inherently cyclical industry where revenue can shift 30–40% in a single year based on freight rates, trade volumes, and geopolitical events. ZIM's leverage to freight rates is structural - the thesis requires either rate stabilisation, an MBO catalyst, or a Suez-driven cost improvement to play out within the 3–6 month window. Investors entering should be comfortable with the volatility profile of cyclical shipping equities and size their position accordingly. The $13.25 stop-loss is non-negotiable discipline for this trade.
- Freight Rate Deterioration Risk: The single most important risk. If freight rates decline materially below Q3 2025 levels of $1,602/TEU - driven by the Suez reopening adding effective capacity, the 2026 order book deliveries, or a demand slowdown - ZIM's Q4 2025 and H1 2026 results could disappoint significantly relative to current guidance. The company's fixed cost base (long-term LNG charter commitments) means that rate declines flow rapidly to the bottom line. Management explicitly warned that "supply growth is expected to outpace demand in the foreseeable future"
- Q4 2025 Net Loss Risk: Management guided that Q4 is trending weaker than originally projected. An analyst on the Q3 call noted that implied Q4 guidance suggests a likely net loss for the quarter. A net loss in Q4 means no Q4 quarterly dividend, removing a near-term income support that has partially sustained institutional ownership. The stock could see selling pressure in December–January from income-oriented holders exiting ahead of a dividend pause
- Suez Canal Reopening - Supply Side Effect: The Suez Canal reopening is a double-edged sword. While ZIM benefits from route efficiency, the broader industry effect is a sudden release of approximately 15–20% of global container capacity currently tied up in longer Cape of Good Hope voyages. This incremental supply, added to an already-elevated order book, could create a rate correction in Q1–Q2 2026 before demand absorbs the additional capacity
- US-China Trade Uncertainty: The November 2025 trade agreement provides near-term tariff relief, but the underlying US-China economic decoupling trend is structural and ongoing. ZIM's CEO noted: "The long-term trend toward economic decoupling between China and the US is likely to persist." Even with tariff reductions, US imports from China may not fully recover to 2022–2023 levels, capping Transpacific volume recovery
- MBO Risk - If It Doesn't Materialise: The MBO catalyst is speculative. If the Board concludes no transaction is viable - or if a deal is announced below the entry zone - the speculative premium evaporates and the stock reverts to pure fundamentals at a time when Q4 earnings are weak. The core thesis does not require MBO to succeed, but its presence in the narrative makes the risk management more complex
- Thesis Invalidation Level: A sustained daily close below $13.25 invalidates the analytical thesis - exit the position and reassess from a fresh perspective. Note that $13.25 is a risk management stop, not the Elliott Wave invalidation level. The EW thesis remains technically intact down to $11.50 (the 78.6% Fibonacci retracement). However, waiting for full EW invalidation would require absorbing an additional 14% loss beyond the $13.25 stop. We choose to exit at $13.25 because: (a) a break of that level signals momentum has failed to hold even short-term structure, and (b) capital preservation at this stage is worth more than waiting for definitive EW resolution. Think of $13.25 as a momentum stop and $11.50 as the technical stop - we use the tighter of the two.
Future Outlook
The Container Shipping Cycle: Where Are We?
Container shipping is among the most cyclical industries in global trade. The 2020–2022 COVID-era super-cycle saw freight rates reach extraordinary levels (Shanghai Containerised Freight Index above 5,000 points) driven by supply chain disruption, port congestion, and demand surge. The subsequent normalisation, compressed by massive newbuild orders placed during peak profitability, has brought rates back to 2019–2020 levels - still above pre-COVID structural levels, but far below the super-cycle peak.
The current cycle has two additional complicating factors: the Red Sea / Suez Canal closure (adding 15–20% to voyage lengths on Asia-Europe routes) and the US-China tariff standoff. Both are resolving in the November 2025 timeframe. The Suez Canal reopening will compress effective freight rates by shortening routes and allowing ships to complete more round trips annually, releasing capacity previously absorbed by longer Cape of Good Hope voyages; the US-China trade agreement will support demand. The net effect is uncertain in the immediate term, but the direction of travel for freight rates - stabilisation at current levels followed by recovery as 2026 demand growth absorbs 2027 deliveries - is the scenario that underpins the $23–$25 target.
Price Target Derivation
Three independent frameworks converge on the $23.00–$25.00 target zone over 3–6 months:
Method 1 - EBITDA Multiple Re-Rating
ZIM's FY2025 EBITDA guidance midpoint is $2.1 billion. At the $16.25 entry midpoint and ~119M shares outstanding, the market cap is ~$1.93B - approximately 0.9× 2025 EBITDA. Even accounting for lease liabilities (the primary "debt" on ZIM's balance sheet, which are structural charter costs rather than financial debt), the EV/EBITDA is remarkably compressed.
For a shipping company with $3B in liquidity, a modern LNG fleet with 5–12 year charter visibility, and ongoing profitability, a trough EV/EBITDA of 1.5× on 2025 figures is defensible - this is already pricing in a 40–50% EBITDA decline in 2026. At 1.5× EBITDA of $2.1B = $3.15B EV; backing out net lease debt to arrive at equity value, and distributing among 119M shares, places fair value in the $22–$24 range.
A 2.0× EBITDA trough multiple - appropriate if 2026 rate stabilisation is partially confirmed - implies equity value in the $26–$28 range, above the target zone.
Method 2 - Book Value and Liquidation Analysis
ZIM's total liquidity stands at $3.01 billion against a market cap of ~$1.93B. The total equity (book value) is $4.02 billion - meaning ZIM trades at 0.48× book value. Adjusting for the fleet's residual value (the 16 owned vessels, plus the purchase options on LNG newbuilds at pre-agreed prices), the net asset value of ZIM's balance sheet alone is significantly above current market pricing.
A company with $3B in cash/liquidity and $4B in equity trading at $1.93B market cap has a negative enterprise value on a cash basis - investors are, in effect, being paid to hold the operating business. This extreme discount cannot persist once capital allocation improves (dividend catch-up in March 2026) or corporate action (MBO) crystallises value.
Historical shipping cycle analysis shows that when listed carriers trade below 0.8× book value with positive cash flow, the average 12-month recovery to 1.2–1.4× book has historically been in the 40–60% range from the trough. The $23–$25 target zone represents approximately 0.59–0.62× book value on today's $4.02B equity - a conservative partial reversion, not a full re-rating to book. A recovery to 1.0× book would imply $34/share.
Method 3 - Catalyst-Driven Price Recovery Analysis
Three specific near-term catalysts - Suez Canal return, US-China trade deal impact on Transpacific volumes, and MBO optionality - each independently capable of driving a 15–25% re-rating, and whose combined effect is additive:
Suez Canal return announcement + first ZIM transit: Historically, shipping stocks re-rate 10–20% on confirmed positive operational transitions. ZIM's Suez return announcement = estimated +10–15% re-rating signal.
Q1 2026 Transpacific volume recovery evidence: If Q4 2025 or Q1 2026 shows Transpacific demand recovering post-trade deal, the forward EBITDA for 2026 gets revised upward, compressing the multiple further. Estimated +10–15% re-rating signal.
March 2026 annual dividend catch-up: A 50% payout on ~$150M full-year net income = ~$75M dividend = ~$0.63/share. At $16.25 entry, this represents a ~3.9% forward yield on a single payment - enough to attract income-oriented buyers and support the floor.
Combined, these three catalysts support the $23–$25 target zone as a 6-month price objective without requiring multiple expansion back to mid-cycle norms.
Catalyst Timeline - November 2025 to May 2026
The 3–6 months from this tip date contain a focused sequence of value-confirming events: (1) Suez Canal operational return (December 2025–January 2026) - ZIM has confirmed it is preparing the operational plan; once insurance and vessel owner approvals are secured, the first Suez transit provides a tangible cost efficiency improvement; (2) Q4 2025 earnings (February 2026) - even with a likely net loss, confirmation that liquidity remains at $3B+ and FY2025 EBITDA met its $2B guidance floor reaffirms the balance sheet thesis; (3) FY2025 annual dividend catch-up (March 2026) - the 50% annual payout calculated against full-year net income; any positive surprise relative to Q4 expectations could materially impact the March distribution; (4) Q1 2026 earnings (May 2026) - first read on post-trade-deal Transpacific volumes and post-Suez cost structure improvements; early signs of rate stabilisation here would confirm target zone achievement; (5) MBO resolution - any timeline on this is speculative, but Board-level changes and the CEO's "no comment" suggest 2026 H1 is the decision window.
Competitor Analysis
The container shipping industry in 2025 is dominated by three mega-carriers (Maersk, MSC, CMA CGM) that collectively control approximately 50% of global capacity, with a second tier of large regionals (COSCO, Hapag-Lloyd, Evergreen, ZIM) competing for the remainder. ZIM's competitive positioning as the most agile mid-tier carrier with the youngest fleet in its segment is best understood in the context of how peers are navigating the same rate and supply environment.
| Company | Capacity (TEU) | 2025 EBITDA (Est.) | Key Strength | EV/EBITDA (approx.) |
|---|---|---|---|---|
| ZIM (NYSE: ZIM) | 709,000 | $2.0B–$2.2B | Agility, LNG fleet, Transpacific focus | ~1.0× |
| Hapag-Lloyd (HLAG.DE) | ~1.8M | ~$4.0B (est.) | Premium service, TNX alliance | ~3.5× |
| A.P. Møller-Maersk (AMKBY) | ~4.2M | ~$6.0B (est.) | Logistics integration, network scale | ~4.0× |
| COSCO Shipping (CICOY) | ~3.0M | N/A (state-owned) | Chinese trade access, state backing | N/A |
| Evergreen Marine (2603.TW) | ~1.6M | ~$2.5B (est.) | Asia-Europe, balanced network | ~2.0× |
Hapag-Lloyd
Hapag-Lloyd is ZIM's closest publicly traded peer on a relative size basis. The German carrier entered 2025 with its newly formed Gemini Cooperation alliance with Maersk, providing network stability but reduced flexibility. Hapag-Lloyd trades at approximately 3.5× 2025 EBITDA - a significant premium to ZIM's ~1.0× - reflecting its larger scale, logistics diversification strategy, and lower perceived volatility. The valuation gap implies ZIM is priced as if it will generate half its 2025 EBITDA in perpetuity, which appears deeply pessimistic given its modern fleet profile and $3B cash position.
Pros vs. ZIM
- Larger scale, broader network coverage
- Gemini Cooperation provides schedule reliability
- Lower earnings volatility
Cons vs. ZIM
- 3.5× EBITDA vs. ZIM at 1.0× - ZIM is the value opportunity
- Less agile in deploying capacity across trades
- Lower LNG fleet proportion than ZIM
A.P. Møller-Maersk
Maersk is the world's second-largest carrier and the bellwether for the entire container shipping sector. Its strategic pivot toward integrated logistics (warehousing, customs, air freight) distinguishes it from pure-play carriers like ZIM. Maersk trades at ~4× EBITDA, pricing in the logistics premium. For ZIM, Maersk's earnings guidance is a leading indicator - when Maersk guides cautiously (as it has for 2025–2026), ZIM's pure shipping exposure amplifies both the downside risk and the eventual recovery upside. Maersk's Gemini alliance with Hapag-Lloyd (effective February 2025) reshuffled the alliance landscape that ZIM navigates - providing one reason ZIM's partnership with MSC became strategically important.
Pros vs. ZIM
- Logistics diversification reduces shipping cycle exposure
- Largest global network, unmatched port presence
- Stable investor base; dividend reinstatement expected
Cons vs. ZIM
- 4× EBITDA vs. ZIM at 1× - ZIM offers 4× the earnings yield
- Logistics integration complexity adds execution risk
- Smaller relative upside in a rate recovery scenario
Evergreen Marine
Taiwan-based Evergreen is among the most balanced mid-large carriers, with strong Asia-Europe and Transpacific presence. Trading on the Taiwan Stock Exchange at ~2.0× EBITDA - approximately double ZIM's multiple - Evergreen represents a mid-point between Maersk's logistics premium and ZIM's extreme value discount. Evergreen does not pay dividends at ZIM's level, and its Taiwan listing limits direct access for many international investors. ZIM's combination of a comparable (and in some routes superior) Transpacific franchise at half Evergreen's EBITDA multiple remains the clearest representation of the market's valuation anomaly.
Pros vs. ZIM
- Balanced Asia-Europe + Transpacific network
- Lower volatility than ZIM; Taiwan institutional ownership
- Large owned fleet reduces charter cost volatility
Cons vs. ZIM
- 2× EBITDA vs. ZIM at 1× - ZIM is significantly cheaper
- Less LNG adoption; higher fuel cost exposure
- Limited share buyback/dividend yield compared to ZIM's history
The ZIM Valuation Anomaly in Competitive Context
The comparison table makes the ZIM value opportunity explicit: ZIM trades at ~1.0× EBITDA while comparable carriers trade at 2–4×. This is not a quality discount - ZIM's fleet is younger than most peers, its LNG adoption is industry-leading, its liquidity is near-unprecedented ($3.01B against $1.93B market cap), and its 9-month 2025 EBITDA of $1.844B annualises above the FY2025 guidance floor. The total equity of $4.02B means ZIM also trades at just 0.48× book - a level only justified for a structurally loss-making business, which ZIM is not. The discount reflects two market fears: (1) 2026 rate deterioration, and (2) Q4 2025 net loss eliminating the dividend. Both are valid risks - but they are already embedded in a 1× EBITDA price. Any positive surprise on either dimension - or any corporate action at a modest premium - closes this valuation gap toward the $23–$25 target.
Technical Analysis
ZIM - Elliott Wave & Fibonacci Structure
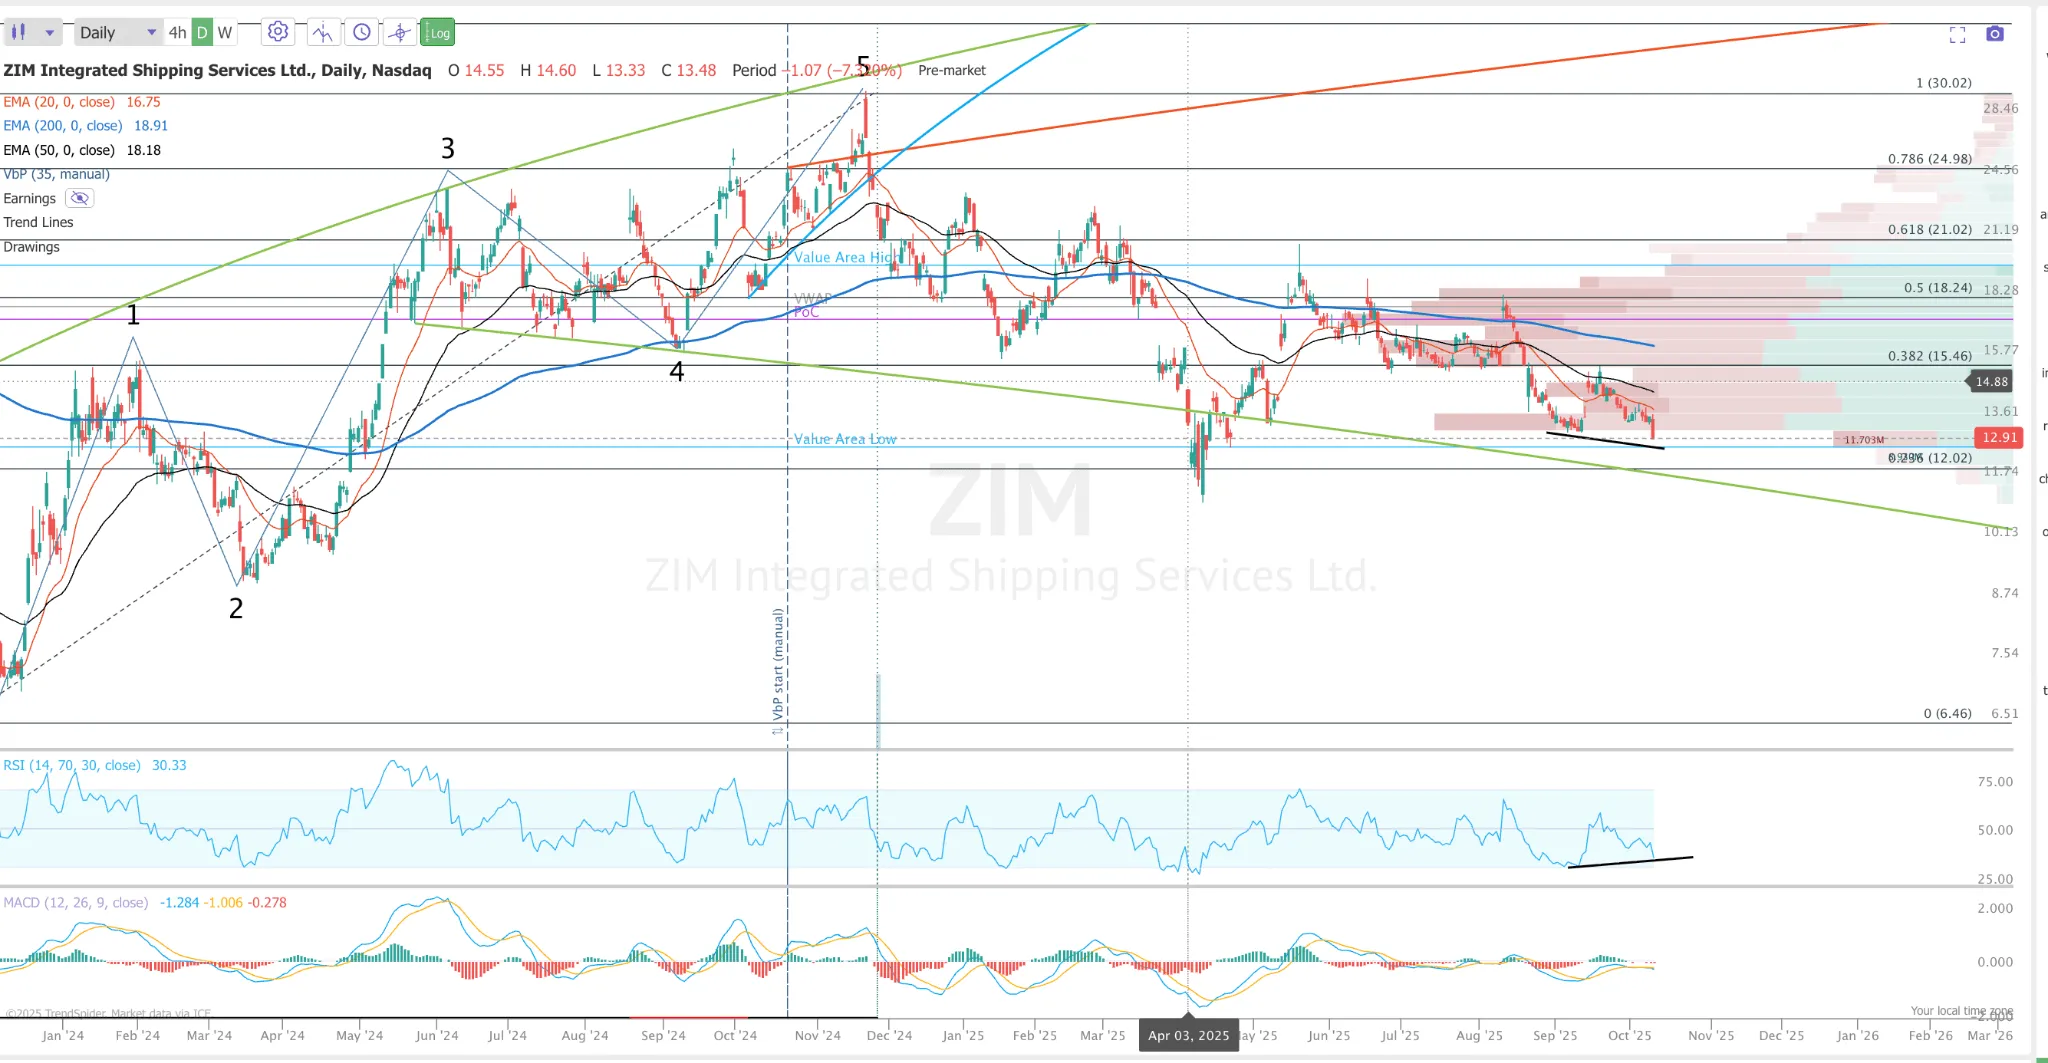
NYSE:ZIM daily chart - 5-wave Elliott Wave impulse (peak $30.02), Fibonacci retracement levels, RSI bullish divergence & MACD approaching cross. EMAs: 20-day ($16.75), 50-day ($18.18), 200-day ($18.91).
Live Price Chart
Elliott Wave Structure: Impulse Complete, Corrective Phase Active
Zooming out on the multi-month ZIM chart reveals a textbook Elliott Wave structure. The stock completed a five-wave motive impulse originating from the 2023 lows near $6.46 and peaking at approximately $30.02 - a gain of roughly 364% driven by the 2024 freight rate spike and Red Sea disruption premium. All five waves are identifiable on the chart: Wave 3 extended toward the peak as the freight super-cycle catalyst drew institutional buying, and Wave 5 completed the sequence before sentiment exhausted and the corrective phase began.
Following the completion of the five-wave impulse, price entered the mandatory corrective phase, retracing the prior advance in a declining ABC pattern driven by freight rate normalisation fears. We are still clearly in a downtrend - all three EMAs (20-day at $16.75, 50-day at $18.18, and 200-day at $18.91) remain above the current price and in bearish alignment, confirming that macro price momentum has not yet reversed. However, the critical question is whether the corrective wave is approaching its natural exhaustion point - and the oscillator signals are starting to suggest it is.
Fibonacci Retracement: Approaching the 78.6% Level
Applying a Fibonacci retracement grid to the completed impulse - from base $6.46 to peak $30.02 - yields the following critical price levels for the corrective wave:
- 23.6% retracement - $24.98: First pullback support after the peak; the initial sell-off stalled in this zone
- 38.2% retracement - $21.02: Mid-cycle support; now a key overhead resistance level on any recovery
- 50.0% retracement - $18.24: Psychological midpoint; aligns closely with the 200-day EMA ($18.91) - the primary resistance ceiling for any initial bounce
- 61.8% retracement - $15.46: The "golden ratio" - defines the original November 2025 entry zone ($15.50–$17.00); was a high-conviction support level on the initial earnings-day setup
- 78.6% retracement - ~$11.50: The deep exhaustion level. The price is now retesting this zone - in Elliott Wave theory, the 78.6% retracement is the deepest structurally valid corrective level before the original impulse would be invalidated. A hold here, supported by oscillator divergences, represents the highest-probability reversal setup on the chart
The 78.6% level (~$11.50) and the defined stop-loss at $13.25 form a closely clustered support band. A sustained close below $11.50 would call the entire Elliott Wave recovery thesis into question. A hold and bounce from this band - especially confirmed by the oscillator signals - creates the structural foundation for the full measured move back toward the $23–$25 target.
Oscillators: Early Signs of a Reversal
- RSI - Bullish Divergence Confirmed: The most significant early reversal signal is a bullish divergence in the RSI. While price has continued making lower lows (confirming the ongoing downtrend), the RSI has been printing higher lows - the textbook signature of weakening bearish momentum and diminishing selling pressure. In Elliott Wave context, RSI bullish divergence at a deep Fibonacci retracement (78.6%) is among the highest-probability reversal setups available. The divergence alone does not confirm a reversal - it signals that sellers are losing conviction even as price continues lower, setting the precondition for a trend change once a fundamental or technical catalyst triggers the first significant higher high.
- MACD - Approaching a Bullish Cross: Complementing the RSI signal, the MACD is potentially nearing a bullish cross - the MACD line is converging upward toward the signal line from below. A confirmed bullish MACD cross would be the first such momentum confirmation since the corrective decline began, and would reinforce the RSI divergence thesis with a second, independent oscillator signal. Historically, bullish MACD crosses at deeply oversold levels in fundamentally sound cyclical stocks - particularly when aligned with a key Fibonacci support zone - have preceded mean-reversion rallies of 30–60% over 3–6 months.
Pattern Watch: Potential Double Bottom at Fibonacci Support
The confluence of the 78.6% Fibonacci retracement zone, bullish RSI divergence, and converging MACD creates conditions for a potential double bottom formation. If price tests the $11.50–$13.25 support band a second time without breaking structurally lower - while oscillators maintain their divergence - the double bottom would be confirmed on a sustained break above the pattern's neckline, which sits approximately at the $16.00–$17.00 zone (the original entry zone and the 61.8% Fibonacci retracement level).
A textbook double bottom with a neckline at $16–$17 projects a measured move of approximately $9–$10 per share above the breakout - placing the price target squarely at $23–$25, consistent with all three fundamental valuation frameworks (EBITDA multiple, book value, and catalyst-driven recovery analysis). The double bottom pattern thus provides independent technical confirmation of the fundamental price target.
The key monitoring criteria: (1) whether price holds above $11.50 (78.6% Fib) and $13.25 (stop-loss) on a daily closing basis; (2) whether RSI holds its higher-low structure on the next downswing; (3) whether the MACD completes its bullish cross ahead of or concurrently with a neckline breakout attempt - a double confirmation that significantly raises the probability of the full measured move completing.
Risk/Reward calculation: Entry midpoint $16.25 | Stop-loss $13.25 (−$3.00 / −18.5%) | Target midpoint $24.00 (+$7.75 / +47.7%) → R/R = 1 : 2.6. The Elliott Wave / Fibonacci framework adds structural conviction: the $23–$25 target aligns with the 23.6% Fibonacci retracement level from the impulse peak - the first natural resistance in a corrective recovery and the projected termination zone for the initial counter-trend bounce.
Investment Strategy
The following scenarios reflect the author’s personal analysis and are not investment recommendations. See our full disclaimer.
Recommendation
A staged approach to ZIM in the $15.50–$17.00 entry zone. The thesis is a multi-catalyst value recovery: ZIM trades at approximately 1× its own FY2025 EBITDA with $3 billion in liquidity against a $1.93B market cap - a valuation anomaly that requires either permanent business impairment or indefinite rate collapse to be justified. Three independent frameworks - EBITDA multiple re-rating to trough norms, liquidation value analysis, and catalyst-driven price recovery - all bracket the $23–$25 target. The R/R of 1:2.6 with a $13.25 stop-loss reflects a high-conviction entry with well-defined downside. The 3–6 month horizon is consistent with the Suez Canal reopening, US-China trade deal impact on Transpacific volumes, and the March 2026 annual dividend catch-up crystallising value. This is a Medium-High Risk tip requiring disciplined position sizing.
Action Plan
- Scenario Entry Range: $15.50–$17.00. Tranche 1 (50%): $15.75–$16.75 immediately after the Q3 earnings release - position into the raised EBITDA guidance midpoint and confirmed dividend catalyst before the market fully digests the Suez Canal return commentary. Tranche 2 (30%): $15.00–$15.75 if the stock initially pulls back on Q4 weakness concern or the "no dividend next quarter" narrative drives institutional selling in the days following earnings. Tranche 3 (20%): $13.50–$14.50 as a maximum-drawdown add near the stop-loss boundary, only if the stock declines on broader market weakness unrelated to ZIM-specific fundamentals
- Risk Consideration: 2–4% of portfolio for medium-risk investors comfortable with cyclical shipping exposure; 1–2% for conservative allocators seeking a value/catalyst trade as a satellite position. ZIM is highly volatile relative to broad market benchmarks - the stock moved 200%+ in 2024 and could move 30–40% in either direction within the 3–6 month window based on freight rate developments. Size accordingly
- Upside Scenario Milestones: First exit (25% of position) at $19.00–$20.00 (immediate resistance zone; take partial profits on the initial earnings-driven rally); second exit (30%) at $21.50–$22.50 (mid-range resistance; lock in the core trade gains before the final push); main exit (35%) at $23.00–$25.00 (three-method target convergence zone); hold remaining 10% as optionality if the MBO crystallises at a premium above $25 or if Suez Canal return + Transpacific recovery produces a more significant rate improvement than the base case assumes
- Thesis Invalidation Level: Daily close below $13.25 invalidates the balance sheet support thesis and signals either Q4 2025 results materially worse than guided (net loss above $200M level), a definitive MBO denial combined with negative 2026 guidance, or a Suez reopening-driven rate collapse well below the base case. A sustained close below $13.25 invalidates the analytical thesis - at that point the setup parameters no longer hold and the position warrants reassessment.
- Catalyst Monitoring: Track weekly spot container freight rates (Shanghai Containerised Freight Index - SCFI); ZIM Suez Canal operational announcement (insurance approval + first transit); US-China trade agreement implementation updates and monthly Transpacific container volume statistics; Q4 2025 results announcement (February 2026); annual dividend top-up declaration (March 2026); any MBO-related Board or shareholder announcements
- Dividend Strategy: ZIM will not pay a Q4 2025 quarterly dividend (net loss expected). The key income event is the March 2026 annual catch-up to 50% of FY2025 net income. On approximately $150M full-year net income (conservative estimate: $123M Q3 + $24M Q2 − modest Q4 loss), the catch-up to 50% implies distributing ~$75M total for the year, minus the $44M already paid in Q1–Q3 ($37M Q3 + $7M Q2), leaving ~$31M ($0.26/share) in the March 2026 distribution - a 1.6% yield on the entry price from a single payment. Any positive Q4 surprise or special dividend declaration would add to this
- Access Method: ZIM trades on the New York Stock Exchange (NYSE: ZIM). Standard brokerage account. Note: ZIM is an Israeli company incorporated under Israeli law - dividends may be subject to Israeli withholding tax (25% standard, reducible to 15% in many tax treaties). US investors should review withholding tax treaty terms with their broker. Eligible for standard US brokerage accounts; check K-1/PFIC status with your tax advisor before holding in tax-advantaged accounts
Important Disclaimer
This content is for informational and educational purposes only and does not constitute financial advice, investment recommendations, or solicitation to buy or sell any securities. Past performance does not guarantee future results. All investments carry risk, including the possible loss of principal. ZIM Integrated Shipping Services Ltd. (NYSE: ZIM) is a cyclical shipping company subject to significant volatility in freight rates, trade volumes, and geopolitical factors. Container shipping freight rates declined approximately 35% year-over-year in Q3 2025 and may continue to decline in 2026 as new vessel supply enters the market and the Suez Canal reopening increases effective industry capacity. ZIM's quarterly net income and dividend payments are highly variable; the Q4 2025 dividend is expected to be suspended due to a likely net loss. Management's FY2025 EBITDA guidance of $2.0B–$2.2B represents company projections - actual results may differ materially. The management buyout discussion referenced in this report is speculative and unconfirmed. ZIM is incorporated in Israel and subject to Israeli corporate and tax law, including dividend withholding taxes that may affect returns for international investors. Always conduct your own research and consult a qualified financial advisor before making investment decisions. The authors and publishers are not responsible for any financial losses resulting from the use of this information.