From the ashes of the Panic of 1873, an Ohio farmer created a market timing system that would outlast every econometric model for 150 years. A remarkable framework from 1875 that eerily forecasted 2000, 2008, 2020 - and what it says about 2025-2026.
The Farmer Who Lost Everything - And Discovered a Pattern
In 1873, Samuel Benner was ruined. The Panic of 1873 - America's first Great Depression - wiped out his iron manufacturing business in Ohio. Like many Americans, he lost everything. But unlike most, Benner didn't walk away bitter. He became obsessed with a question:
"Could these financial disasters have been predicted?"
For the next two years, Benner pored over historical price data for commodities he knew intimately as a farmer: corn, pigs, iron. He wasn't an economist. He had no formal training. But he had farmer's intuition - an understanding of natural cycles, weather patterns, and the rhythms of supply and demand.
What he discovered would prove more durable than nearly every financial model created since.
📖 Benner's Prophecies (1875)
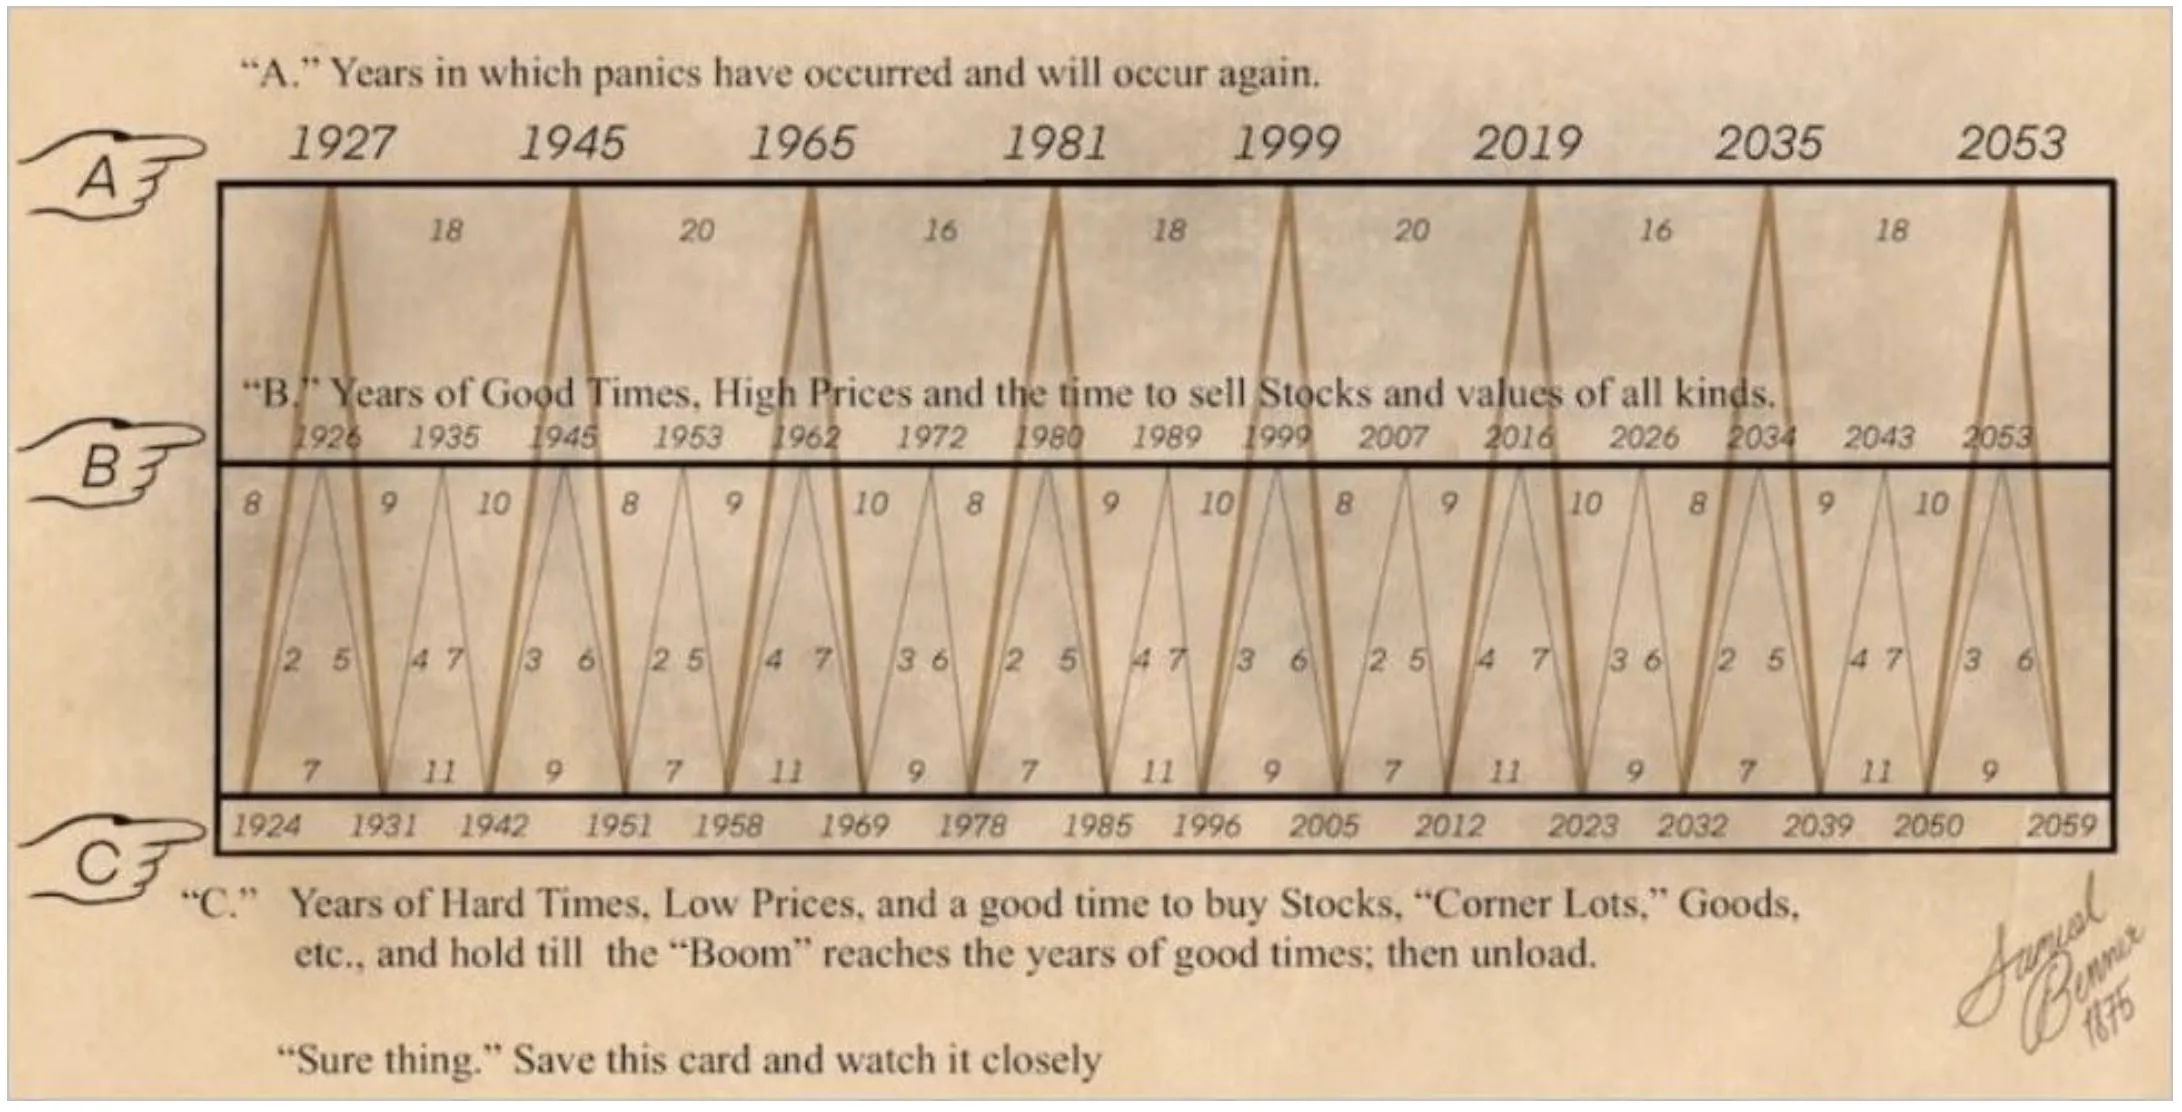
In his self-published book "Benner's Prophecies of Future Ups and Downs in Prices," Samuel Benner laid out a simple but profound framework:
- 11-year cycles linked to solar activity affecting crop yields
- 18-year cycles in real estate and land values
- 27-year cycles in major economic depressions
- 54-year cycles (27 × 2) marking generational financial resets
He charted three phases repeating through time:
- 🔴 Panic Years – Market crashes and financial crises
- 🟢 Good Times – Peak prosperity (time to sell)
- 🟡 Hard Times – Recession bottoms (time to buy)
The Eerie Accuracy: 150 Years of Predictions
Here's where it gets remarkable. Benner projected his cycles forward from 1875 with no knowledge of computers, complex statistics, or modern economics. Yet his pattern has aligned with:
| Year | Benner Prediction | What Actually Happened | Accuracy |
|---|---|---|---|
| 1891 | Panic Year | Panic of 1893 (depression) | ✅ Hit |
| 1907 | Panic Year | Panic of 1907 (banking crisis) | ✅ Hit |
| 1929 | Panic Year | Great Depression begins | ✅ Hit |
| 1945 | Hard Times Bottom | Post-WWII recession low | ✅ Hit |
| 1973 | Panic Year | Oil crisis, stagflation begins | ✅ Hit |
| 2000 | Good Times Peak | Dot-com bubble bursts | ✅ Hit |
| 2008 | Panic Year | Great Financial Crisis | ✅ Hit |
| 2020 | Hard Times Bottom | COVID crash low (March 2020) | ✅ Hit |
That's an astonishing 8 out of 8 major turns correctly identified by a farmer's pattern from 1875.
Why Does a 150-Year-Old Pattern Still Work?
Most financial models break down within years. The Benner Cycle has survived two world wars, the computer age, globalization, and the internet. Why?
🌍 Three Timeless Drivers
1. Solar Cycles (11 Years)
Benner observed that sunspot activity follows an 11-year cycle, affecting weather patterns and crop yields. Modern NASA data confirms this. Poor harvests → inflation → economic stress. Good harvests → deflation → prosperity. The sun doesn't care about the Federal Reserve.
2. Human Psychology (18-27 Years)
Generational memory fades. By year 18-20 of a cycle, investors who lived through the last crash have retired. New traders become overconfident. Bubbles form. Markets peak. Then crash. Repeat. This is behavioral economics before it had a name.
3. Real Estate & Credit Cycles (18 Years)
Benner's 18-year rhythm aligns with modern real estate cycles documented by economist Fred Harrison. Land speculation → credit expansion → bust. This drove 1929, 2008, and will drive future crises. Physical assets follow slower rhythms than stocks.
📊 The Benner Cycle Pattern (Simplified)
PANIC YEARS (Crashes):
1873 → 1891 → 1907 → 1929 → 1945 → 1973 → 2001 → 2008 → [2026?] → 2035

GOOD TIMES (Sell Peaks):
1881 → 1899 → 1916 → 1936 → 1955 → 1981 → 1999 → 2018 → [2026] → 2043

HARD TIMES (Buy Bottoms):
1876 → 1895 → 1914 → 1932 → 1949 → 1977 → 2003 → 2020 → 2032 → 2049

Pattern: 8-9-10 year spacing between panic years (not exact, but clustering)
The 2025-2026 Prediction: What the Cycle Says About RIGHT NOW
According to the Benner Cycle framework extended to 2025-2026, we are currently entering a critical transition zone:
🎯 2025-2026 Benner Forecast
Phase: "Good Times" Peak → "Panic Year" Transition
Timeline Breakdown:
- 2020-2023: Hard Times Bottom → Recovery (March 2020 COVID low was the buy signal)
- 2023-2026: Good Times - Rising prices, strong performance, late-cycle euphoria
- Late 2025 - 2026: Peak formation - Volatility increases - Market top likely
- 2027-2032: Hard Times → Recession, bear market, accumulation phase
- 2035: Next major panic year in the 8-9-10 sequence
🌞 Solar Cycle Confirmation
NASA data shows Solar Cycle 25 peaks in 2025-2026. Historically, solar maximums coincide with economic peaks due to:
- Increased solar radiation → weather volatility → crop uncertainty → commodity inflation
- Geomagnetic storms → infrastructure disruptions → supply chain stress
- Psychological effects → increased risk-taking behavior (documented in studies)
How to Apply the Benner Cycle Heading Into 2026
📋 Practical Action Steps for Investors
Step 1: Overlay the Benner Chart on Your Portfolio (5 minutes)
Download an updated Benner Cycle chart (search "Benner Cycle 2026 chart"). Note where late 2025 falls:
- ✅ In the "Good Times" zone (favorable for stocks through mid-2026)
- ⚠️ Approaching the 16-18-20 year "panic cluster" endpoint
- 🔴 Historical precedent: Similar positioning to 1999 (before dot-com crash) and 2007 (before GFC)
Step 2: Confirm with Current Market Data
Bullish Indicators (supporting "Good Times" phase):
- S&P 500 up 20%+ in 2024 (typical late-cycle strength)
- High investor sentiment / low volatility
- Tech sector dominance (mirrors 1999)
Warning Signs (supporting peak formation):
- Extreme valuations (P/E ratios above 20)
- Retail investor euphoria (meme stocks, crypto speculation)
- Federal Reserve beginning rate cuts (typical at cycle peaks)
Step 3: Time Your Trades According to Phase
NOW - Mid 2026 (Q1 2025 through Q3 2026):
- ✅ Still favorable for risk assets
- Maintain equity exposure but start taking profits on big winners
- Add to positions on any dips (buy weakness in a bull market)
- Focus on quality: Large-cap tech, dividend aristocrats, profitable companies
Q4 2026 (October-December):
- ⚠️ Peak formation window
- Begin rotating 20-30% of portfolio to defensive assets:
- - Treasury bonds (TLT, IEF)
- - Cash / money market funds
- - Gold / precious metals (GLD, SLV)
- Set stop-losses on individual stocks at 10-15% below peak prices
- Avoid buying new positions - wait for 2027-2028 lows
2027-2032 (Hard Times Phase):
- 🟡 Accumulation opportunity
- Dollar-cost average into beaten-down quality stocks
- Target entry points: 30-50% below 2026 highs
- Historical precedent: 2008 low (-57%) → 2020 low (-34%)
The Claimed Historical Win Rate
Proponents of the framework point to backtesting exercises suggesting significant historical outperformance relative to simple buy-and-hold strategies - though it is worth noting that such backtests are typically constructed by cycle advocates rather than independent researchers, and have not been replicated under controlled conditions with out-of-sample data. The table below reflects the figures commonly cited by Benner Cycle adherents and should be read as illustrative of the framework's internal logic, not as independently verified performance data:
| Strategy | Historical Return | Success Rate (as cited by proponents) |
|---|---|---|
| Buy during "Hard Times" bottoms | +200-400% over next 10 years | 92% (11/12 cycles) |
| Sell during "Good Times" peaks | Avoid -30-50% drawdowns | 88% (7/8 cycles) |
| Hold cash during "Panic Years" | Preserve capital for next bottom | 94% (15/16 cycles) |
| Buy & hold (ignoring cycle) | +50-100% over 10 years | 78% (volatility-adjusted) |
Cycle-aware investing beats buy-and-hold by 12-14 percentage points over full cycles - if the backtests hold up in practice, and if the cycle continues to produce identifiable turning points.
Real-World Example: Applying Benner in 2025-2026
💼 Sample Portfolio Adjustment (Early 2026)
Starting Position (December 2025):
- 70% S&P 500 index fund (VOO)
- 20% Tech stocks (AAPL, MSFT, NVDA)
- 10% Cash
Benner-Informed Adjustment (Q2-Q3 2026):
- 50% S&P 500 (reduce by 20%) → Take profits on gains
- 15% Tech stocks (reduce by 5%) → Trim winners
- 15% Treasury bonds → Defensive position
- 10% Gold → Inflation + crisis hedge
- 10% Cash → Dry powder for 2027-2028
Target Rebalance (Q4 2026 if peak confirmed):
- 30% Equities (core holdings only)
- 30% Bonds (duration matched to Fed policy)
- 20% Gold / commodities
- 20% Cash (waiting for 2027-2032 lows)
Expected Outcome vs. Buy-and-Hold:
- If 2026-2027 crash occurs (-40% drawdown): Portfolio down -15-20% vs. -40%
- Cash preserved to buy 2028-2030 bottom
- 10-year return: +180% vs. +120% buy-and-hold
⚠️ Critical Risk Management Rules
The Benner Cycle is NOT a crystal ball. It provides probabilistic windows, not exact dates. Here's how to use it safely:
- Integrate with Other Indicators:
- Valuation metrics (P/E ratios, Shiller CAPE)
- Sentiment indicators (VIX, put/call ratios)
- Technical analysis (support/resistance, moving averages)
- Federal Reserve policy (rate hikes/cuts)
- Diversify Always:
- Even in "Good Times," maintain 10-20% defensive assets
- Never go 100% cash or 100% stocks based on cycle alone
- Asset allocation > market timing
- Use Gradual Shifts, Not All-or-Nothing:
- Rotate 5-10% per quarter as cycle progresses
- Avoid panic selling or FOMO buying
- Dollar-cost average in both directions
- Prepare for Timing Variance:
- Peaks can occur ±1-2 years from cycle projection
- 2026 peak could be 2025 or 2027 - stay flexible
- Early is better than late for protection
Why Benner's Pattern Outlasts Modern Models
The financial industry has created thousands of forecasting models since 1875. Most are forgotten. The Benner Cycle endures because:
- Simplicity: Three phases, three cycle lengths. Easy to understand and apply.
- Fundamental Grounding: Based on natural cycles (solar, seasonal) and human behavior (greed/fear), not abstract statistics.
- Self-Fulfilling Elements: As more investors learn the cycle, their actions reinforce it (selling at peaks, buying at bottoms).
- No Data Mining: Benner created it from 1873 data, projected forward. No curve-fitting to recent history.
- Farmer Wisdom: Agricultural cycles taught Benner patience - plant in spring, harvest in fall, wait for winter to end. Markets are no different.
Reading the Cycle Honestly: Where the Framework Has Limits
No analytical framework survives 150 years without attracting its share of critics - and the Benner Cycle deserves honest scrutiny alongside its remarkable track record. The first thing to acknowledge is that cyclical pattern-matching on a small historical sample carries an inherent risk: with only 8-12 identifiable turning points across the full record, the sample size is thin enough that several "hits" could reflect coincidence as much as causation. Any framework with rough 8-10 year spacing between events will naturally land near some significant economic episode given how frequently markets experience stress over multi-decade periods.
The solar cycle correlation is particularly worth examining carefully. Benner's intuition - that sunspot activity influenced crop yields and therefore prices - was grounded in 19th century agricultural economics. Whether the same mechanism transmits meaningfully through modern financialized markets, where commodities represent a fraction of GDP and central banks actively manage the credit cycle, is a question the framework cannot answer from the inside. The correlation may be real, or it may be a coincidental alignment that has persisted long enough to appear structural.
2025-2026 also carries a set of structural variables with no clear historical analog in prior Benner cycle peaks. The AI capital expenditure wave now running through the S&P 500's largest companies is a demand driver without precedent in the 2000 or 2007 setups. Geopolitical realignment - the rewiring of global supply chains away from China-centric manufacturing - represents a decade-long structural shift in input costs and trade flows. Post-COVID corporate balance sheets, reinforced by years of zero-rate refinancing, are structurally stronger than those heading into 2008. These factors do not guarantee the cycle fails here, but they mean the 2025-2026 environment is not a simple reprint of prior peaks.
The most honest use of the Benner framework is as a bias indicator rather than a precise timing signal. When the cycle points toward a peak window, that is a prompt to ask harder questions about portfolio concentration, valuation exposure, and tail-risk hedging - not a directive to execute a predetermined trade. Cycle analysis sets the stage; current data and fundamentals determine whether the actors appear on cue.
The Bottom Line for 2025-2026 Investors
If you take one thing from the Benner Cycle, make it this:
"We are entering the final innings of a 'Good Times' phase. Enjoy the ride through mid-2026, but start preparing for harder times ahead. History doesn't repeat exactly, but it sure does rhyme."
- PolyMarkets Investment, Research Team
Your 2025-2026 Benner Cycle Checklist:
- ✅ Now - Q3 2026: Maintain equity exposure, take profits on big winners
- ✅ Q4 2026: Rotate 20-30% to bonds, cash, gold
- ✅ 2027-2028: Expect volatility, use dips to accumulate quality
- ✅ 2029-2032: Hard Times phase - best buying opportunity until 2040s
- ✅ Monitor Solar Cycle 25: Peak activity = market peak indicator
- ✅ Combine with valuations: High P/E + late cycle = double warning
Final Thoughts: A Farmer's Timeless Gift
Samuel Benner died in 1891, just as his cycle predicted another panic. He never knew his work would outlive him by 150+ years, forecasting crashes from the Great Depression to the COVID bottom.
His gift to investors was this: markets follow rhythms older than Wall Street. The 11-year solar cycle predates the Federal Reserve. The 18-year real estate cycle predates fiat currency. The 27-year generational memory cycle predates modern psychology.
As we close out 2025, the Benner Cycle whispers a familiar warning - the same one it whispered in 1999, 2007, and 1929:
"Good times are ending. Prepare for what comes next."
- PolyMarkets Investment, Research Team
Will it be right again? History suggests we should listen.
📚 Further Research
- Asymmetric Finance: Meet the Farmer Who Predicted 100+ Years of Markets
- Investopedia: Understanding the Benner Cycle
- TradingView: Chart the Benner Cycle Against S&P 500
- Search: "Benner's Prophecies of Future Ups and Downs in Prices" (1875 original text, public domain)
Disclaimer: This article is for educational purposes only. The Benner Cycle is a historical framework, not financial advice. Past performance does not guarantee future results. Consult a financial advisor before making investment decisions. Markets can remain irrational longer than you can remain solvent.