The survival question is settled. Bitcoin legitimacy is no longer something serious people argue about - the SEC, BlackRock, and the U.S. Treasury have effectively closed that debate by participating in it. The real question is harder: can Bitcoin consistently function as actual digital gold inside global institutional portfolios, or will the volatility profile that defined its first decade keep reasserting itself just as the institutions get comfortable?
Three things happened in the last 18 months that actually matter. Spot Bitcoin ETFs got approved in the U.S. - and almost immediately started hoovering up coins at a pace that surprised even the bulls. The April 2024 halving dropped new supply issuance to 3.125 BTC per block. And institutional participation crossed from "exploratory" into something that looks structurally different. Taken together, Bitcoin is now trading more like a macro instrument than a casino chip. The transition wasn't frictionless, but it happened.
What follows is a systematic evaluation of Bitcoin as a market infrastructure asset - supply mechanics, demand segmentation, on-chain health, the macro and regulatory backdrop, and a forward-looking scenario framework. One question runs through all of it: does the data actually support the store-of-value thesis, or is structural risk still mispriced?
1 Origins and Evolution
Fifteen years. That's how long it took to go from a cryptographic experiment passing between cypherpunks on mailing lists to a multi-trillion-dollar asset sitting in sovereign wealth fund portfolios. And it wasn't a straight line. Each phase was contingent on the previous one - the infrastructure built during crypto winter made the institutional entry possible, and the institutional entry made the ETF approval, eventually, inevitable.
2 Supply Economics and Emission
Bitcoin's supply structure is what makes it structurally unlike every other financial instrument. A mathematically enforced hard cap. A disinflationary emission schedule. Predictable supply shocks every four years. You can argue about whether people are pricing it correctly - but you cannot change the code.
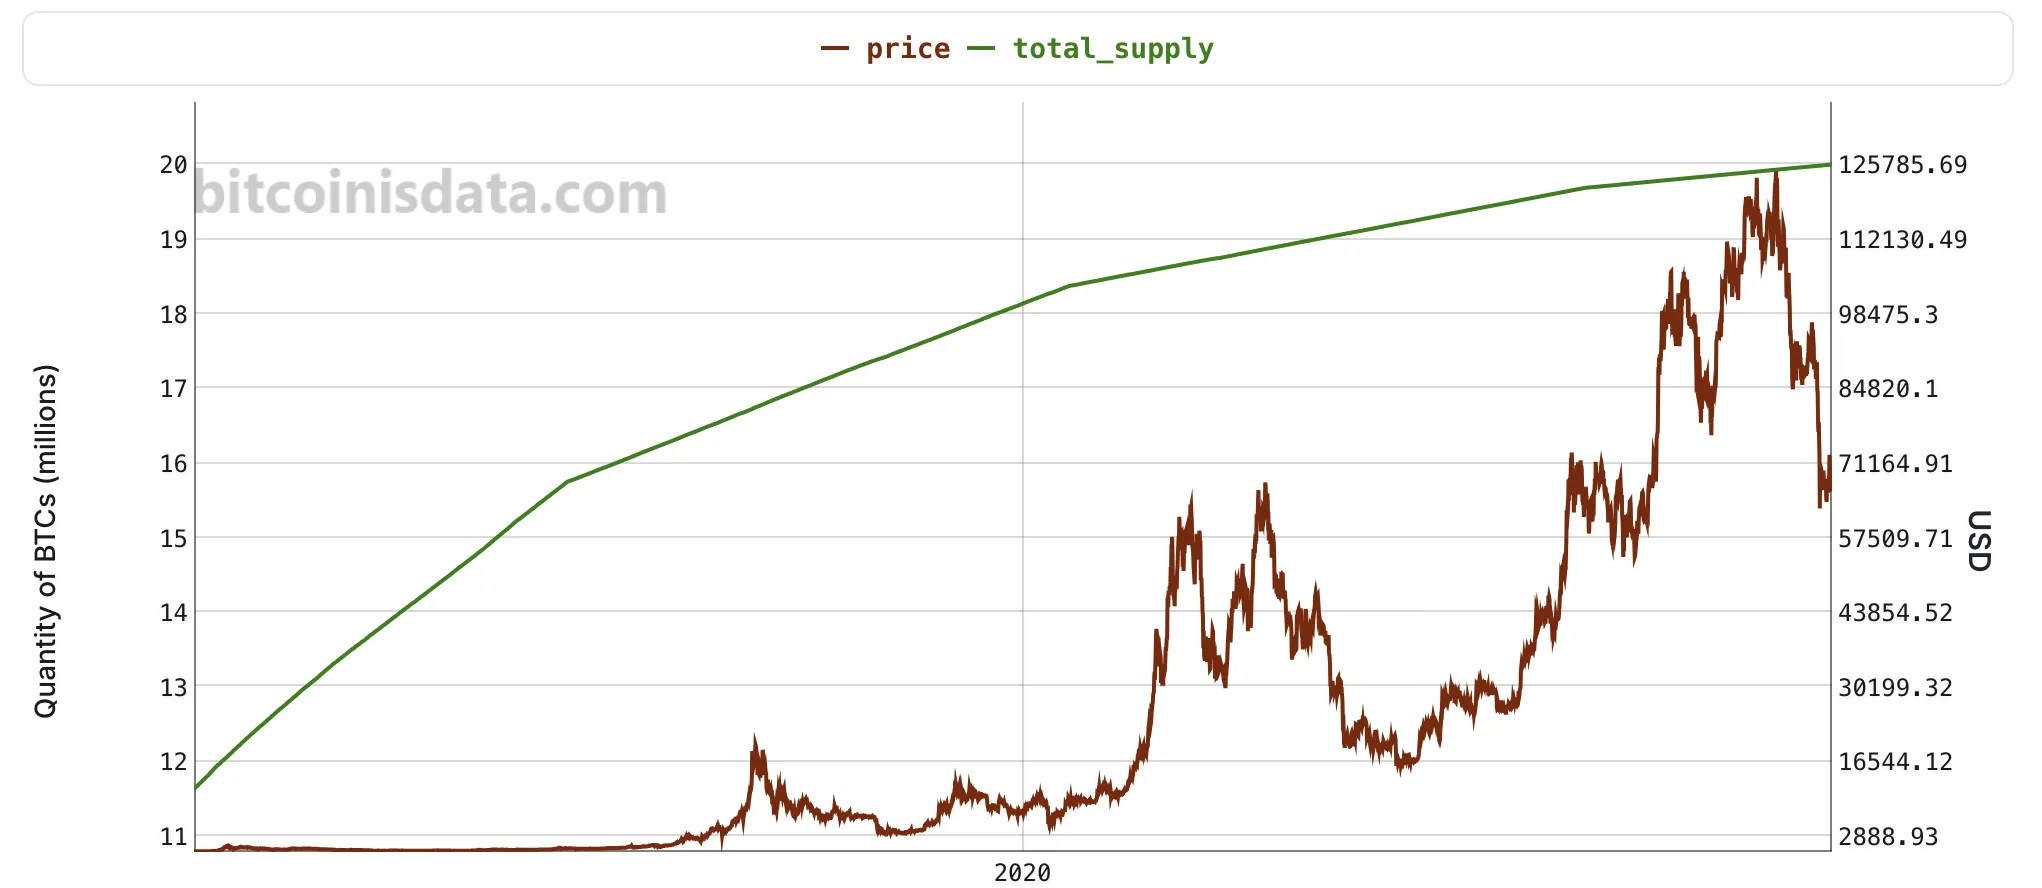
The 21 million cap isn't a marketing concept - it's embedded in protocol code since 2009, and changing it would require consensus from the entire network. As of 2025, over 19.7 million BTC have already been mined. We're at 94% of total supply. The rest trickles out gradually until roughly 2140, at which point block rewards hit zero and miners switch to running on transaction fees alone. Whether that model works at scale is a legitimate long-term question. But it's a problem for 2090.
Then there are the coins that are simply gone. Glassnode and Chainalysis put the estimate at 3-4 million BTC permanently inaccessible - lost private keys, early wallets nobody controls, transfers to addresses that will never be touched again. That's more than 15% of total supply. Gone. And on top of that, over 70% of circulating supply hasn't moved in more than a year. What's actually available to trade is a remarkably thin slice of the headline 19.7 million figure. The market is structurally tighter than most people realize when they look at the headline numbers.
3 Demand: Drivers and Segments
Demand in this cycle looks nothing like 2017 or even 2021. Then, it was retail mania amplified by leverage. Now you've got institutional flows, long-term retail holders who genuinely don't sell, macro overlay from global liquidity conditions, and miner economics creating periodic overhead. More segmented. More structurally grounded. That changes the character of corrections - they tend to be shallower and recover faster than the old playbook would suggest.
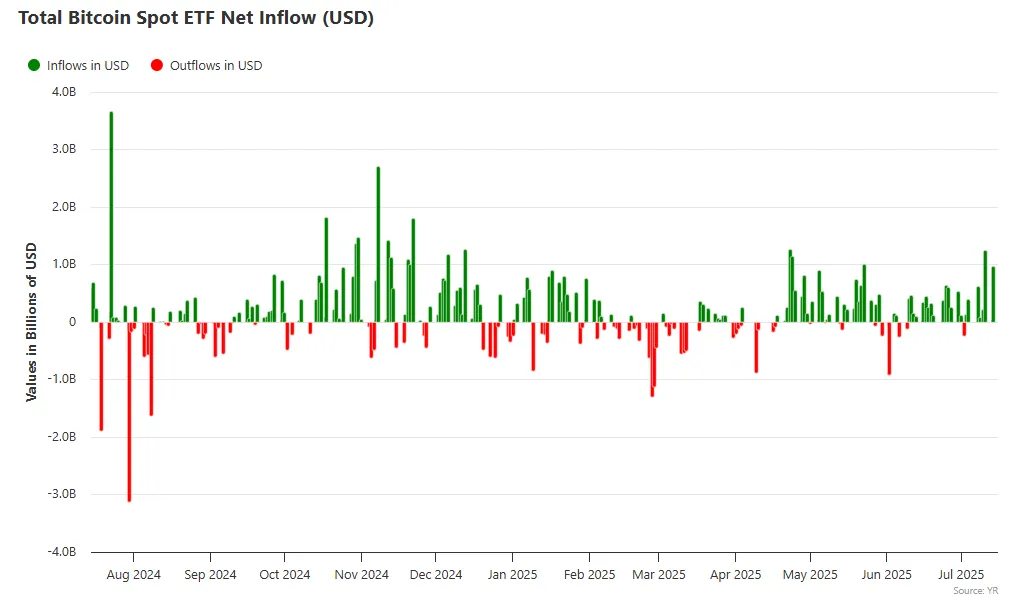
January 2024 changed the demand math permanently. BlackRock's IBIT alone holds approximately 661,457 BTC - something like 3.15% of total supply, all sitting in regulated custody. Add Fidelity, Ark, VanEck, and Franklin Templeton and you're above 900,000 coins held across ETF structures. And here's what matters about that number: these aren't trading positions. The ETF structure doesn't sell when sentiment wobbles. Coins go in, they sit in custody, and they only come back to market if institutions themselves decide to redeem - which is a far higher bar than a retail investor deciding to take profits on a rough Wednesday.
Retail is saying the same thing. Over 70% of BTC hasn't moved in more than a year. The HODLer base has become the structural floor under price - and it's different from prior cycles because these people aren't leveraged. They're not getting margin-called into selling. They just hold. Bloomberg flagged record ETF inflows in May 2025 coinciding with measurable gold outflows. Whether that's a permanent rotation or a temporary trade is genuinely debatable, but it's a data point worth taking seriously if you care about whether Bitcoin is carving actual space inside macro allocation frameworks.
4 On-Chain Metrics
On-chain data cuts through the noise of market sentiment to show what is actually happening on the Bitcoin network - how often people transact, how much economic value moves, and how many unique participants are active. These are the figures that reveal genuine network health, independent of price.
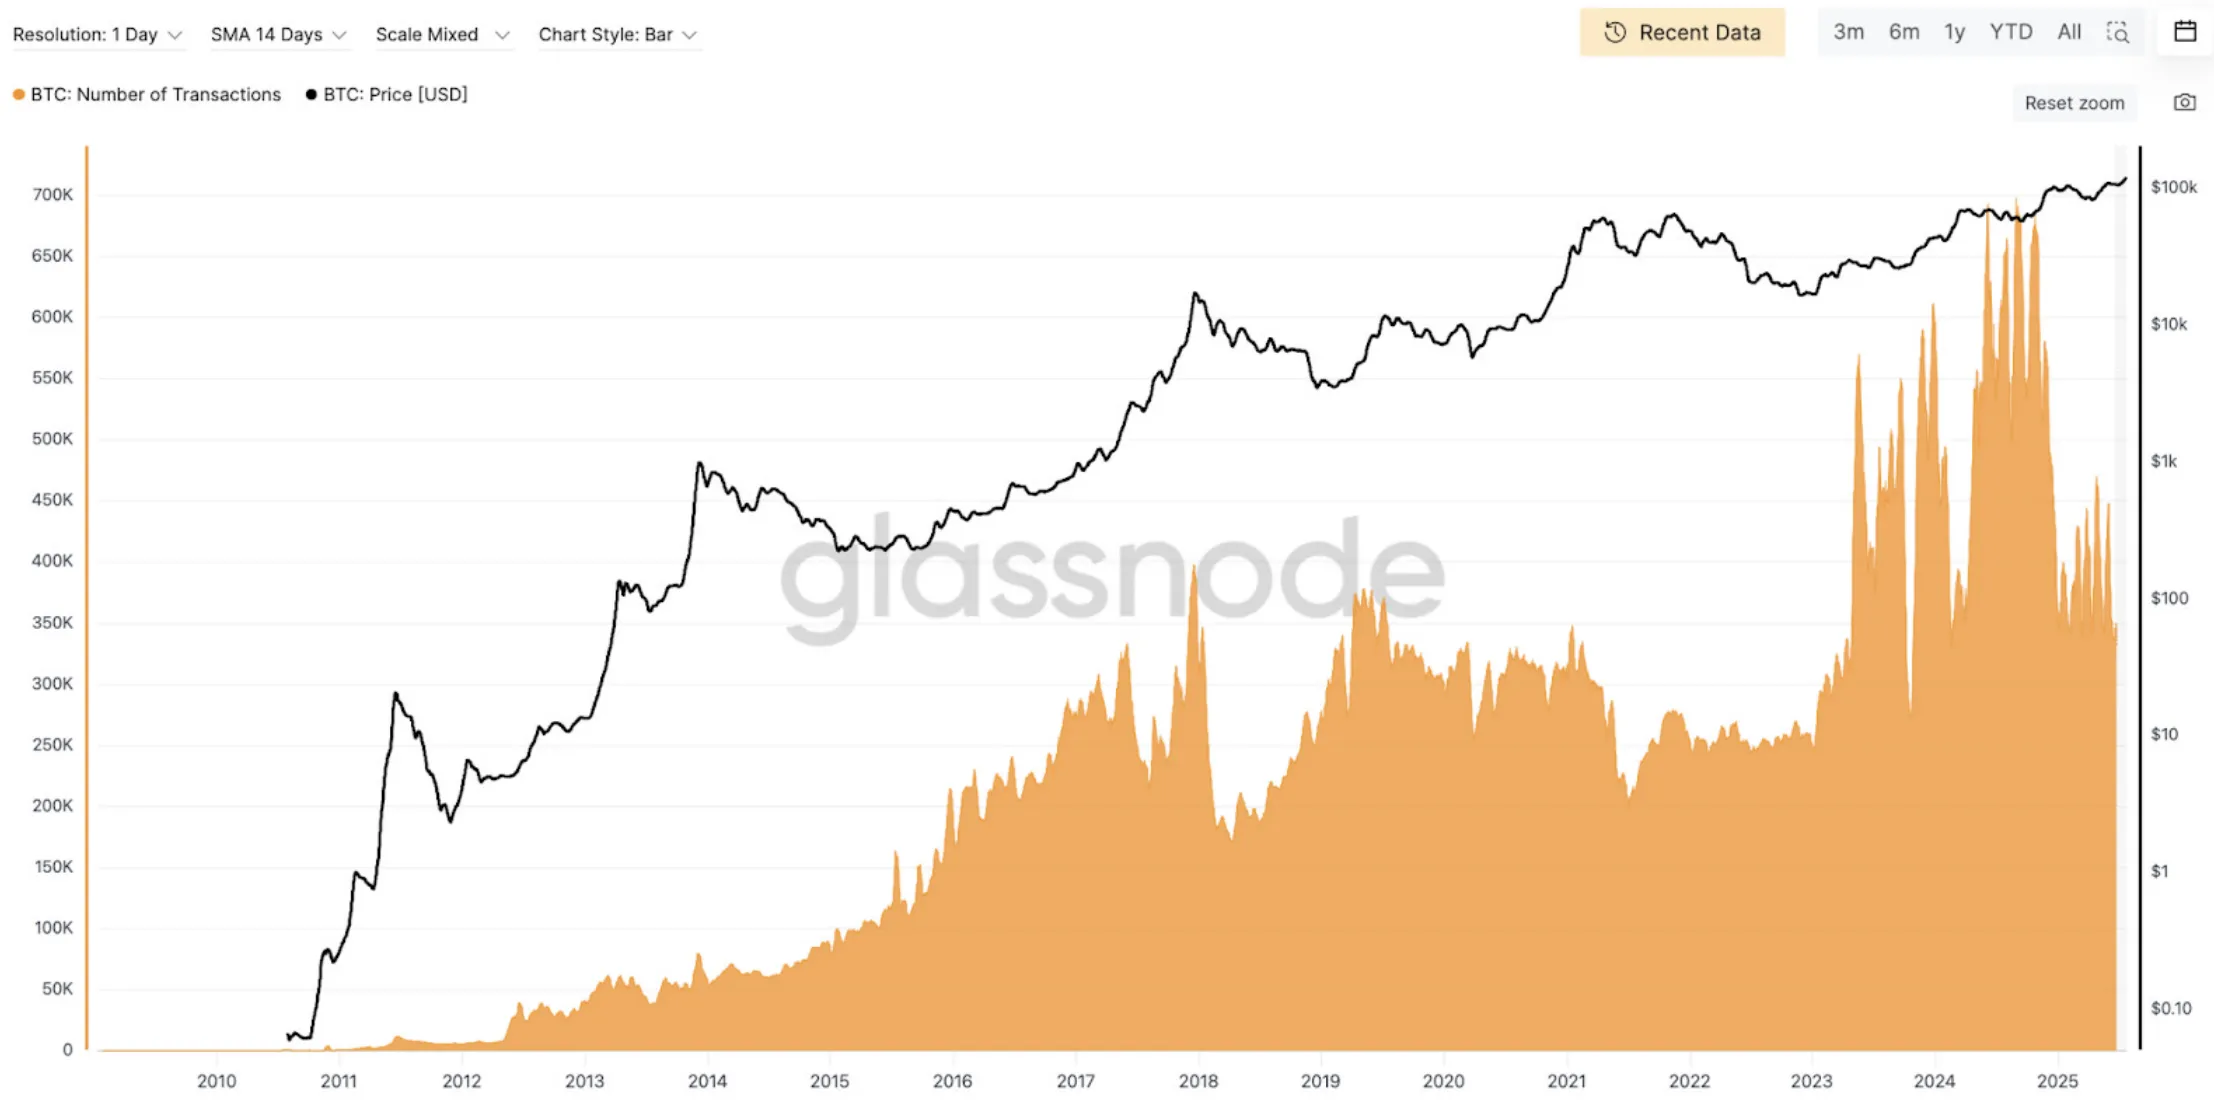
Transaction count is the most direct measure of network utilization - how often the blockchain is being put to work. A sustained rise signals growing real-world demand for block space, which in turn reinforces Bitcoin's security budget through fee revenue. A decline signals stagnation. For a network whose value proposition rests on being an unbreakable settlement layer, usage statistics aren't cosmetic - they're the foundation of the security model itself.
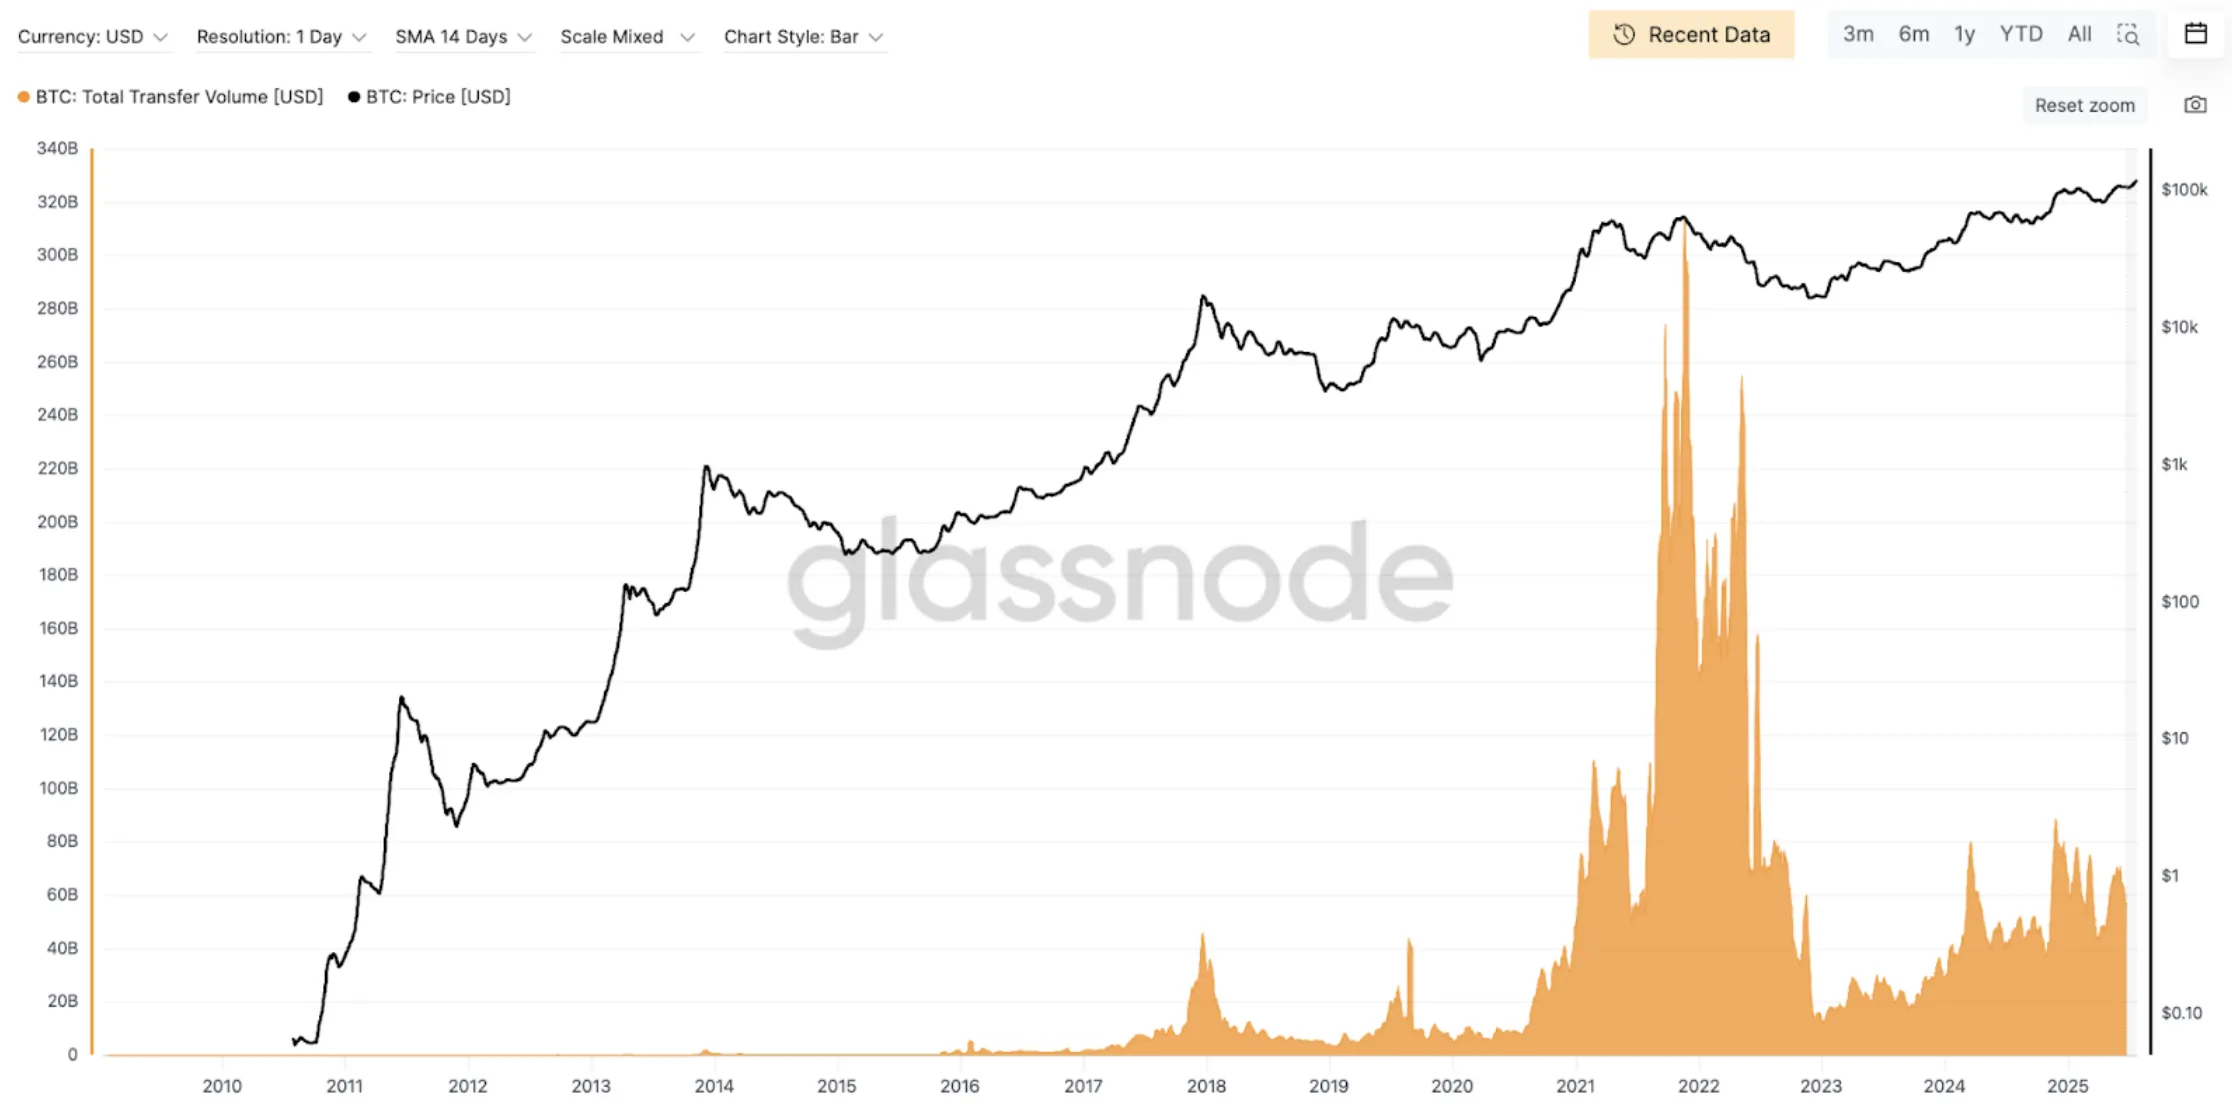
Transfer volume reveals the economic weight behind network activity - what transaction count alone cannot capture. A single institutional settlement of $500 million carries more market signal than ten thousand small peer-to-peer transfers. When institutional transfer volume rises, it points to Bitcoin being treated as a settlement-grade asset by serious counterparties. Average on-chain transfer volume ran at $6–10 billion per day in 2025, sitting 30–40% below the 2021 peaks - partly because more activity has migrated off-chain to ETFs, exchanges, and the Lightning Network, which is itself a sign of a maturing ecosystem rather than declining demand.
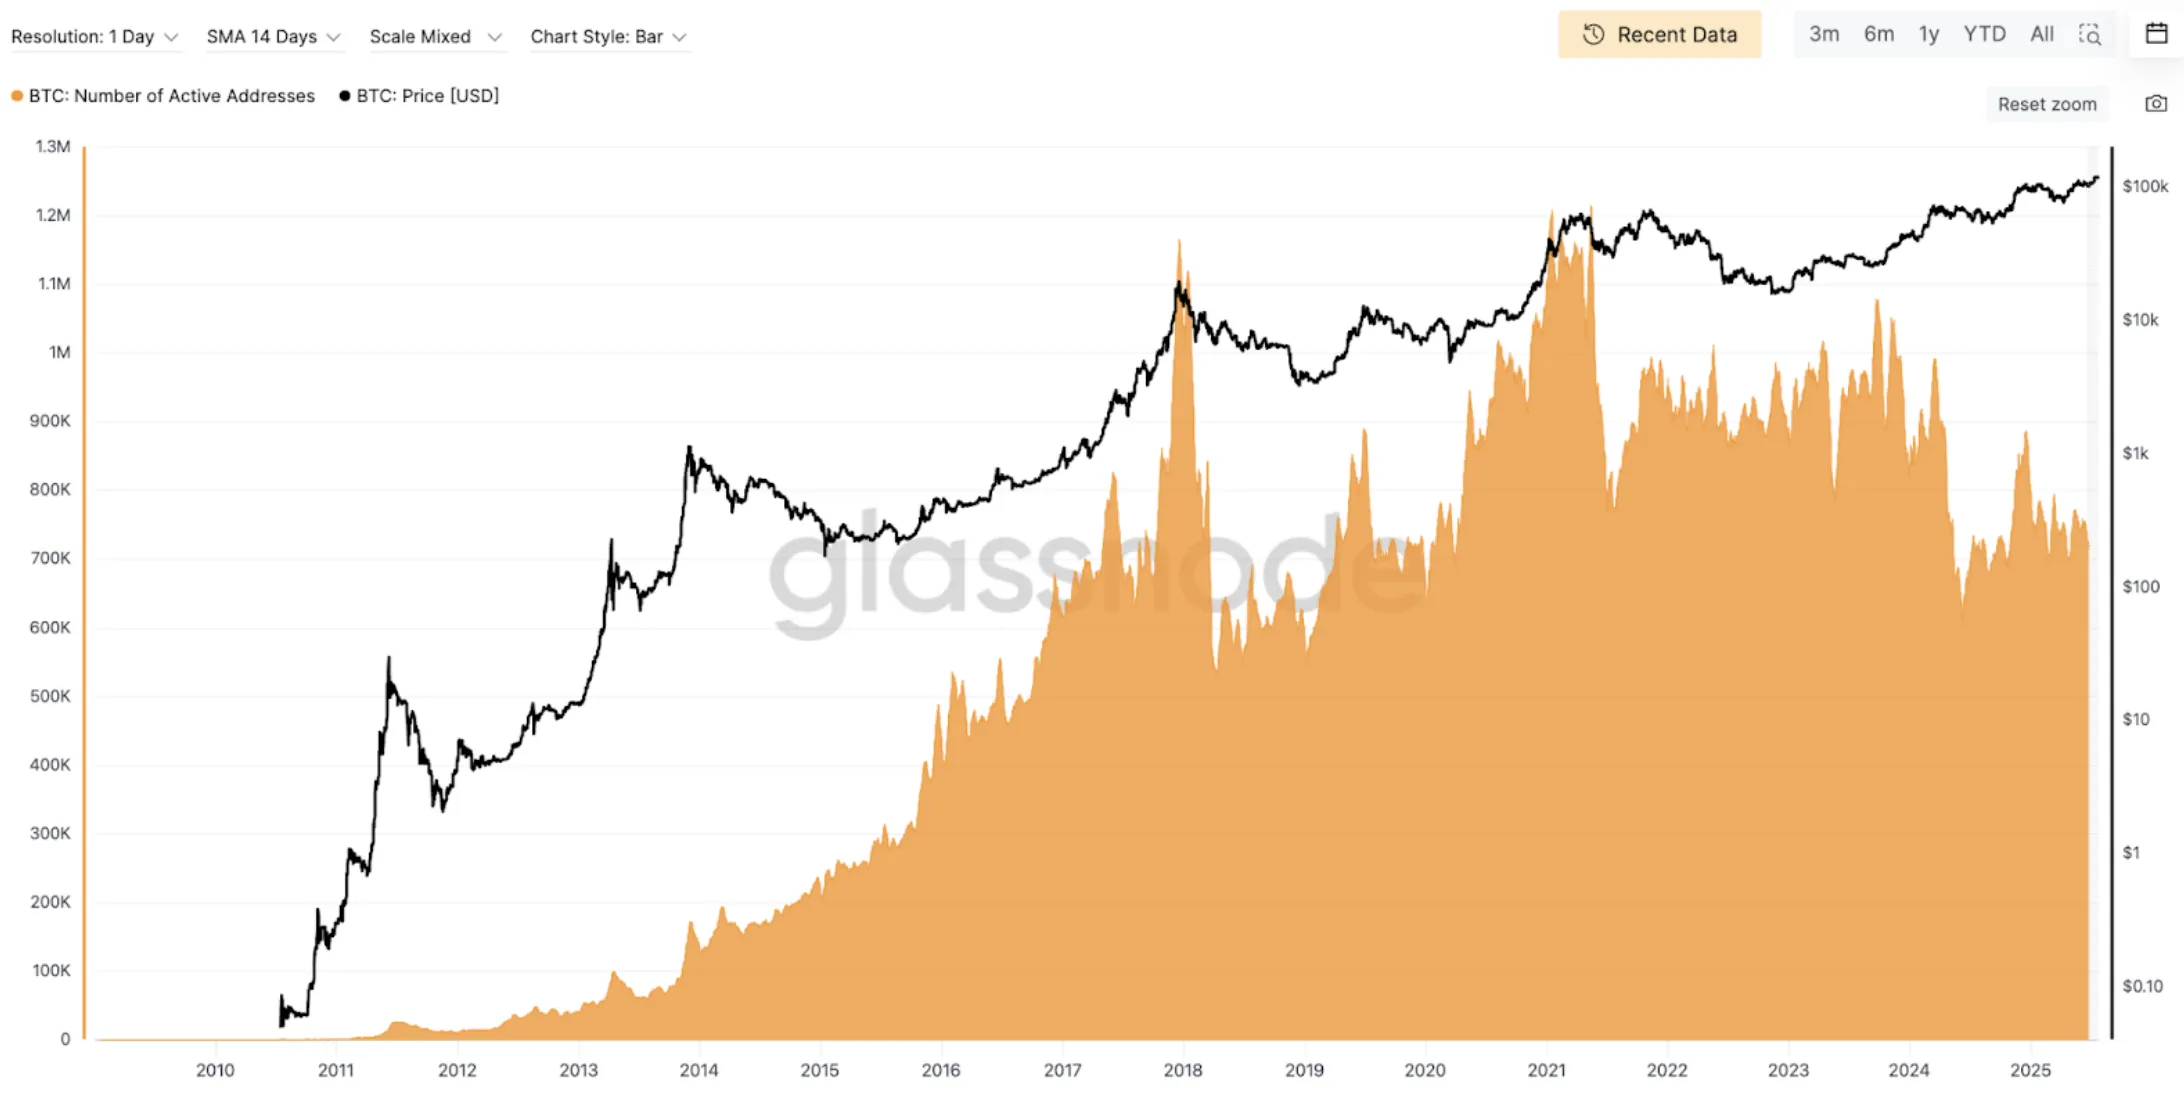
Active address count measures the breadth of participation - unique wallets that transacted on any given day. In 2025, daily active addresses stabilized at 800K–1M, roughly matching 2020–2021 participation levels. New address creation eased after the ETF-launch spike of early 2024, but the interpretation here matters: the slowdown reflects coins migrating into long-term cold storage, not user abandonment. An engaged base of HODLers choosing not to transact is structurally different from a disengaged network.
5 On-Chain Sentiment Indicators
Beyond raw network activity, a specific set of on-chain indicators allows us to read where Bitcoin sits within its market cycle - measuring the collective unrealized profit position of all participants, the profitability of coins being actively spent, and how current market value compares to the aggregate cost basis across the entire network. These are the indicators we follow to monitor Bitcoin's evolving value and investor behaviour.
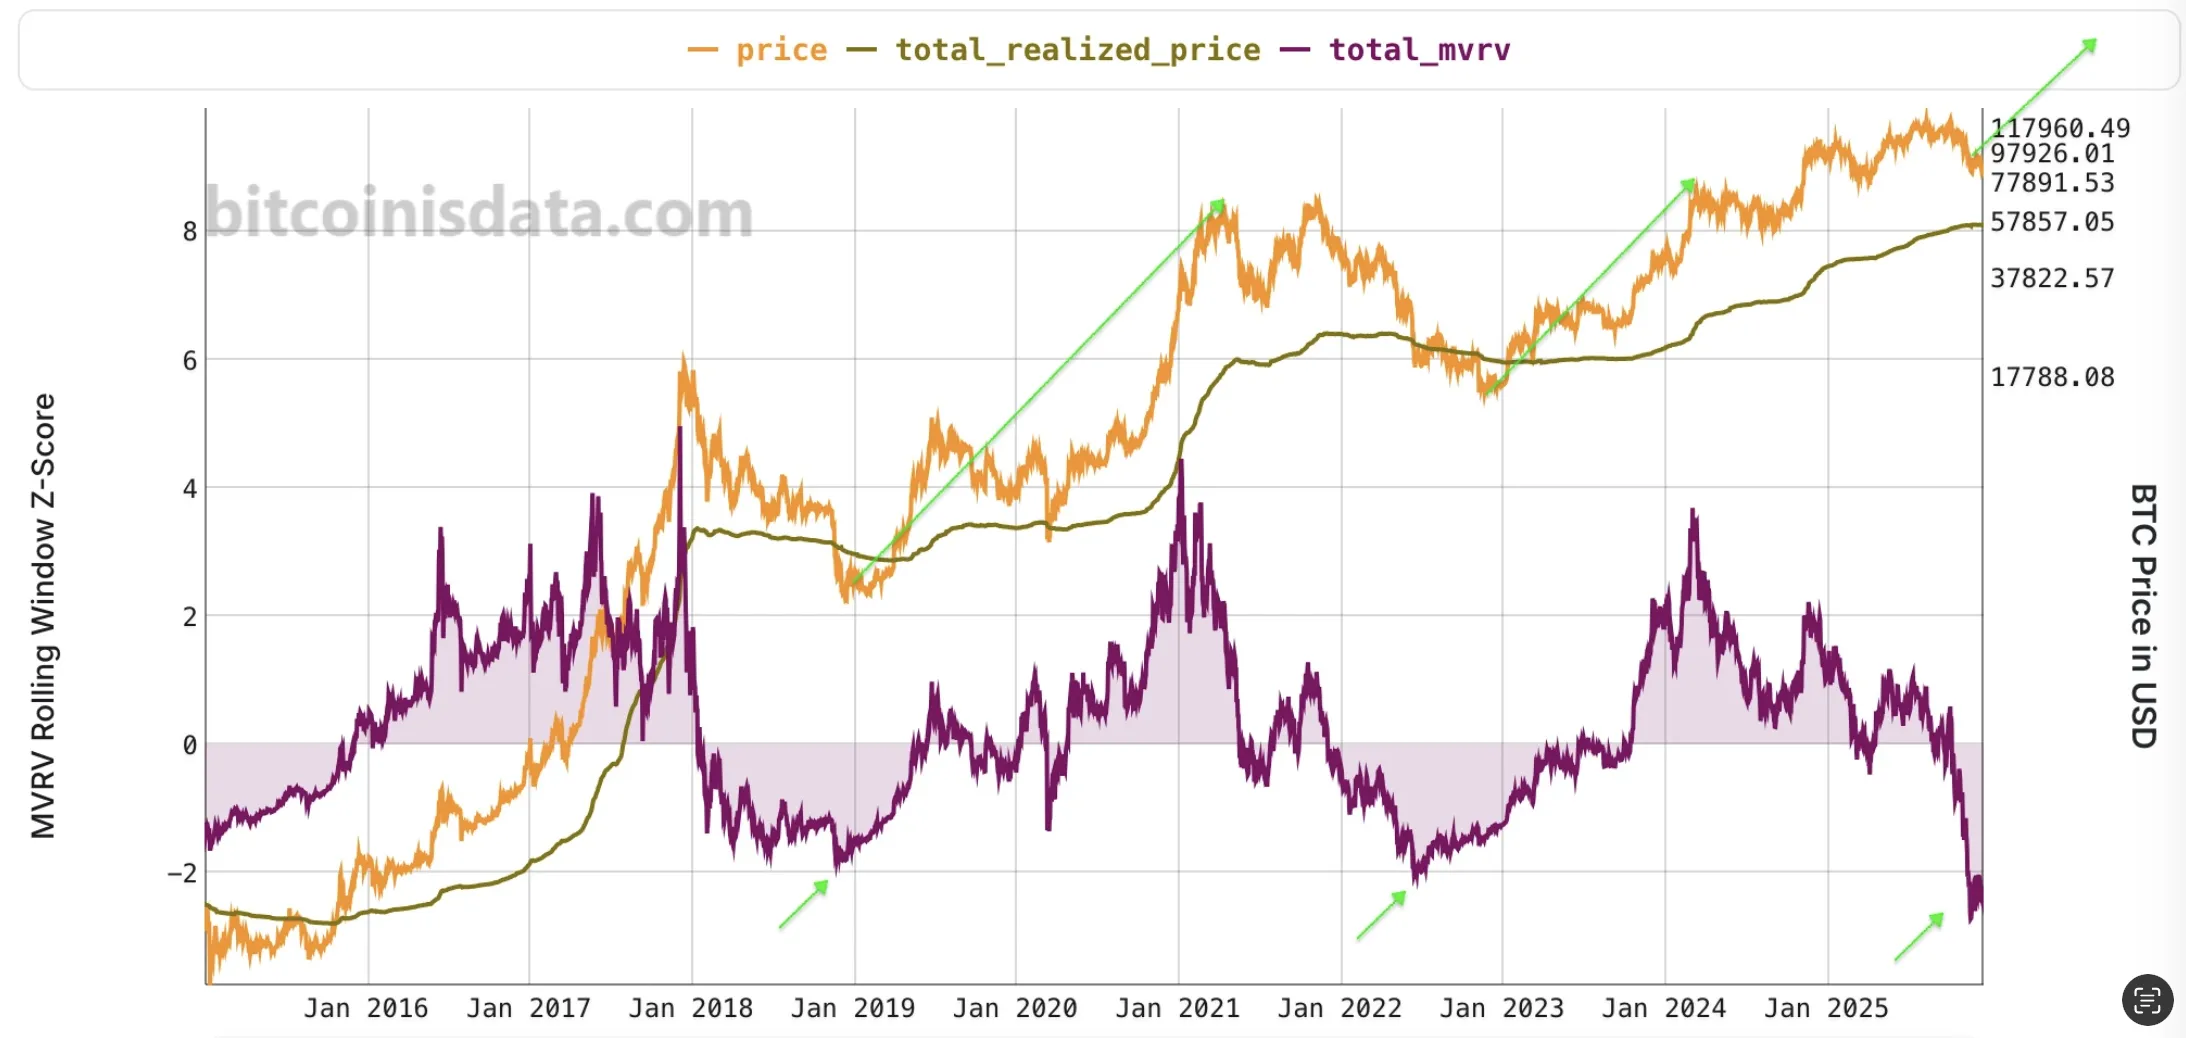
The MVRV-Z Score is the on-chain equivalent of a valuation multiple. It takes the ratio of market capitalization to realized capitalization - where realized cap represents the total value of all BTC at the price each coin last moved, essentially the network's aggregate cost basis - and normalizes it by its historical standard deviation. The result places current valuations in statistical context relative to every prior cycle. Values above 7 have historically coincided with major market tops. Values below −0.5 have reliably marked generational buying opportunities. In the current cycle, the MVRV-Z has not approached either extreme, suggesting Bitcoin is trading within a structurally rational range rather than in bubble or capitulation territory.
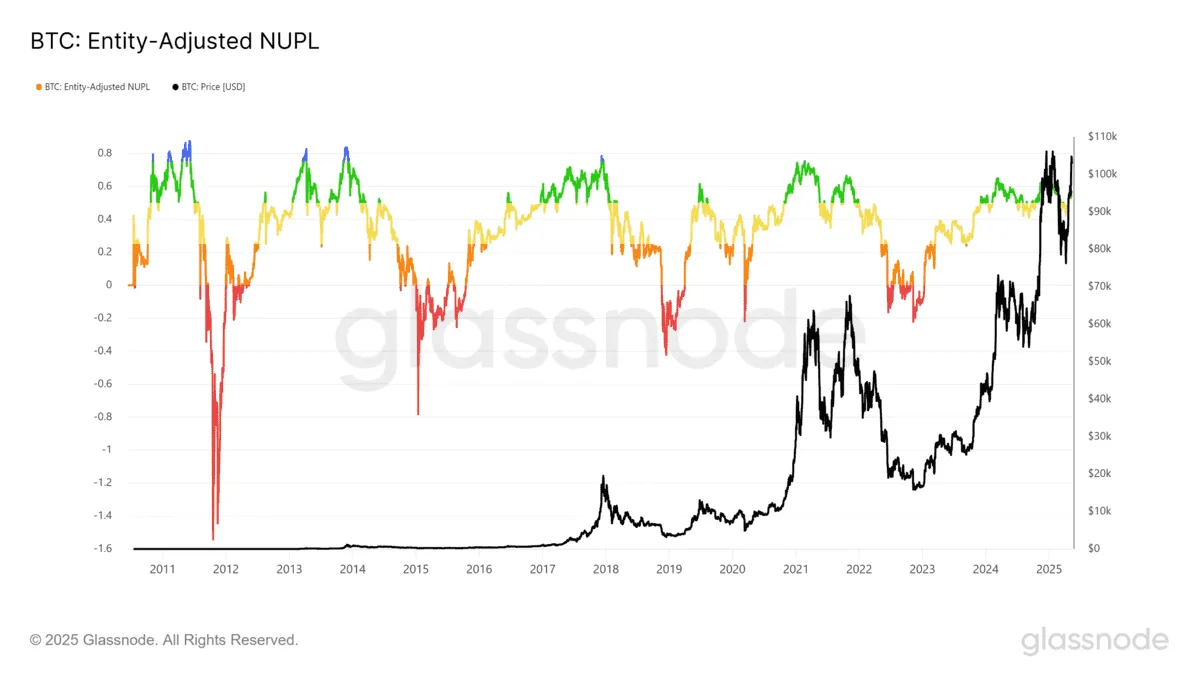
NUPL compresses the entire profit-and-loss picture of the Bitcoin market into a single reading. Subtract realized cap from market cap, divide by market cap, and you get the aggregate unrealized gain or loss of every holder expressed as a percentage of total market value. When NUPL climbs above 0.7, the majority of participants are sitting on substantial gains - and history shows this is precisely when distribution pressure builds. The market doesn't need bad news to sell off; it just needs enough people in large enough profit that taking some off the table looks rational.
The flip side is equally instructive. Sustained negative NUPL readings - where the average holder is underwater - have marked Bitcoin's most durable bottoms. At those points, most of the forced selling has already happened, capitulation has been digested, and the remaining holders have demonstrated the conviction to absorb drawdowns. NUPL is not a precise timing tool, but as a measure of broad market psychology it has few equals.
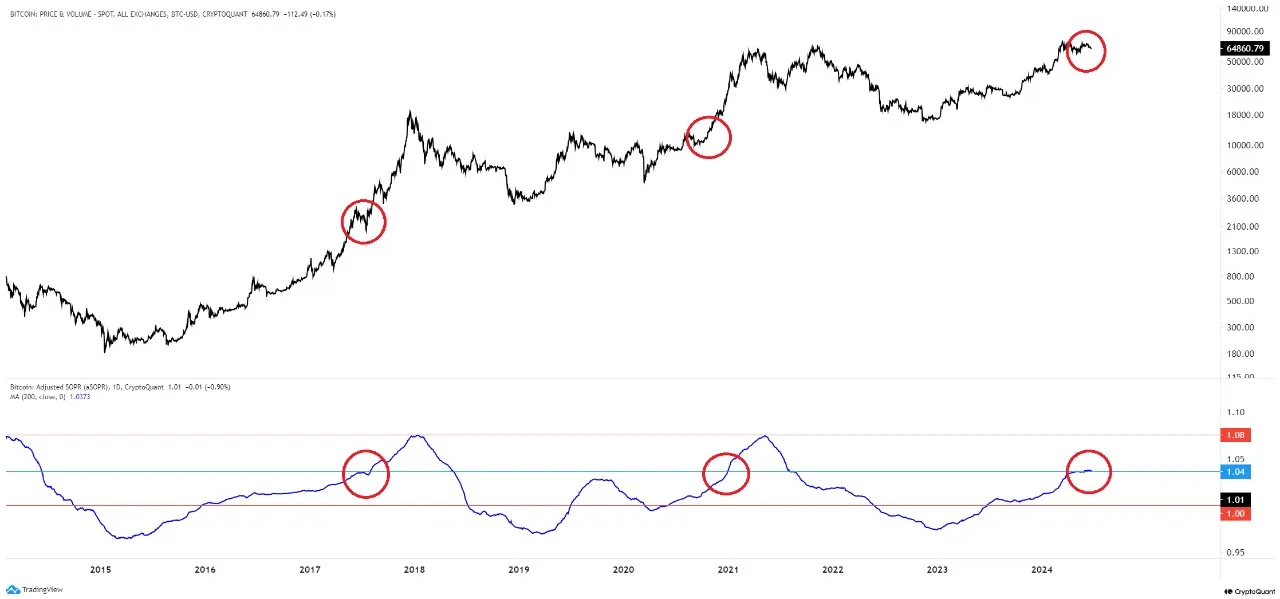
Where MVRV-Z and NUPL capture aggregate positioning, aSOPR zooms in on what is actually being sold right now. It measures the average profit or loss ratio of coins that moved in the last 24 hours, filtering out intra-hour noise to focus on economically meaningful transfers. Above 1.0, sellers are in profit - the market is healthy and demand is absorbing supply. Below 1.0, sellers are taking losses, which sounds bearish but often signals the opposite: sustained sub-1.0 readings indicate that weak hands have exhausted their supply, capitulation is near completion, and coins are migrating toward stronger holders willing to absorb them at a loss-adjusted price.
The most actionable aSOPR signal is how it behaves at the 1.0 boundary during a recovery. In bull trends, price dips that pull aSOPR back toward 1.0 tend to find support - holders refuse to sell at breakeven. In bear trends, that same level becomes resistance, with sellers using rallies to exit at cost. Watching the 1.0 level reveals more about short-term sentiment than most price-based indicators combined.
6 Macroeconomic Context and Regulation
Bitcoin is becoming increasingly integrated into the global financial system. Macroeconomic factors now exert material influence on its performance - what was once a self-contained market now responds directly to global liquidity conditions, monetary policy, and shifts in risk appetite.
The Federal Reserve and other major central banks are the primary external drivers of crypto market cycles. Rate cuts beginning in December 2024 and ongoing balance sheet dynamics have directly supported Bitcoin's price trajectory. The correlation with the S&P 500 and Nasdaq varies but remains moderately positive - Bitcoin tends to perform well during risk-on phases and corrects during flight-to-safety rotations. That pattern frustrates investors who want Bitcoin to behave as an uncorrelated safe haven, but it reflects the reality of a market still dominated by risk-appetite allocation decisions rather than independent monetary logic.
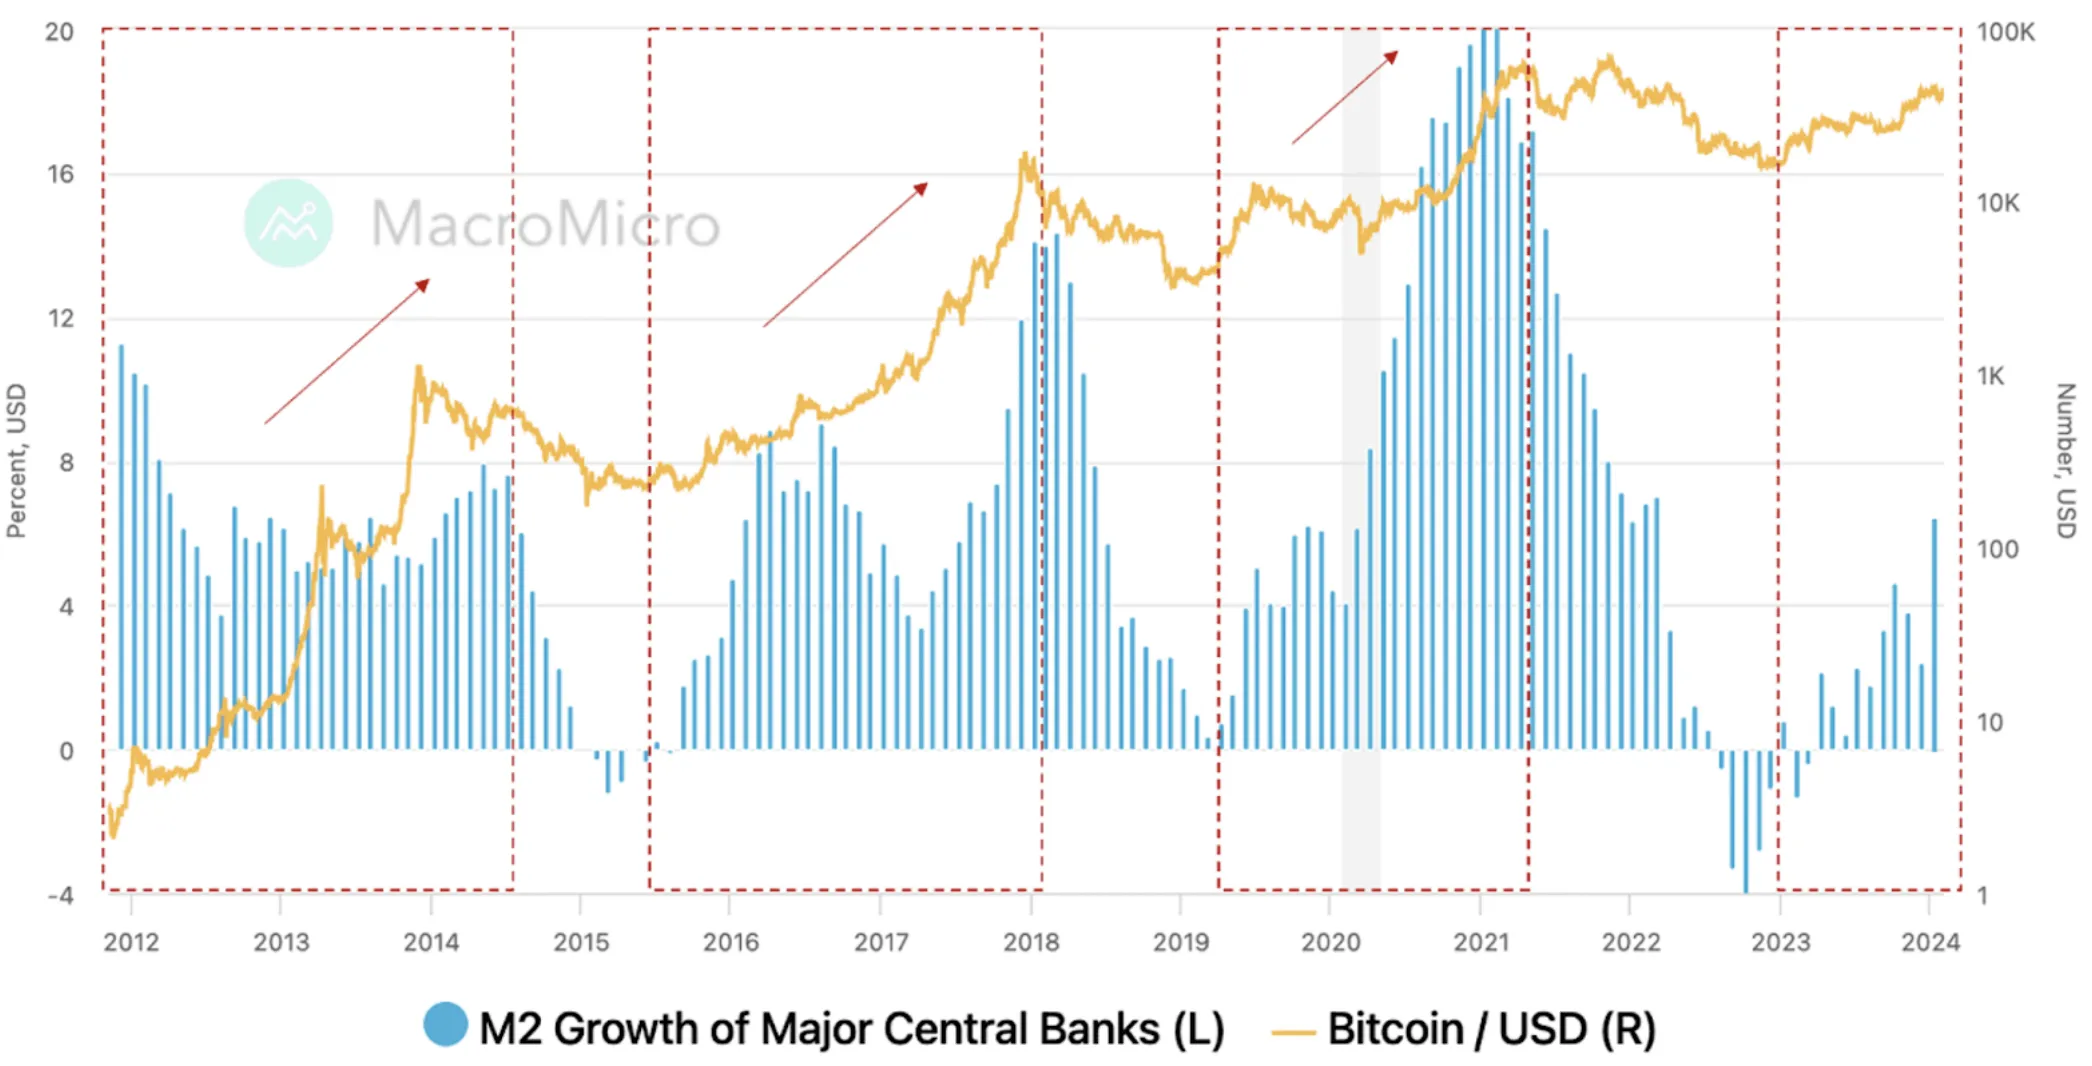
One of the most consistent macro relationships in Bitcoin's history is its correlation with global M2 money supply expansion. When the Fed, ECB, PBoC, and BoJ collectively expand their balance sheets, Bitcoin has historically followed with significant upward moves. The inverse holds as well - periods of synchronized monetary tightening have aligned with Bitcoin's deepest drawdowns. This is not coincidence. It reflects Bitcoin's growing role as a global liquidity barometer: a borderless asset that rises when the world is being flooded with currency and contracts when that liquidity is being drained. The M2 relationship has become one of the cleaner macro lenses through which to frame medium-term Bitcoin positioning.
There is also a demand driver that receives less attention in Western markets: currency instability. In Turkey, Argentina, Nigeria, and across parts of the Global South, local devaluations and capital controls have made Bitcoin a practical alternative store of value. For populations without access to stable banking systems or hard currency savings, Bitcoin functions less like a speculative asset and more like digital insurance - something to hold when your local currency is eroding faster than any investment return can compensate.
The regulatory picture has clarified materially. The U.S. has shifted from aggressive hostility toward formal oversight - the SEC, CFTC, and FinCEN are establishing product standards around ETFs and custody. The EU's MiCA framework introduces unified licensing, reporting, and investor protection rules across member states. Asia remains fragmented, with China's trading ban still in place while Hong Kong builds a separate regulated ecosystem. The net effect: institutional participation has expanded, but compliance costs have risen. Regulation is simultaneously Bitcoin's greatest legitimizing force and its most material near-term risk factor.
7 Forward Market Scenarios
The honest answer is that Bitcoin's 2025–2026 path depends almost entirely on two variables it cannot control: global liquidity conditions and regulatory direction. The structural case - constrained supply, institutional inflows, on-chain accumulation - is as strong as it has ever been. But that structural case has been strong before in cycles that still produced 80% drawdowns. What follows is an honest probability-weighted view across four scenarios.
8 Monitoring Framework and Investment Thesis
The monitoring framework below outlines the key indicators for assessing Bitcoin's market state across four dimensions: on-chain activity, macro conditions, institutional behavior, and protocol development. Tracking these together provides the clearest picture of where Bitcoin actually stands at any given moment.
- Exchange inflows/outflows - selling pressure vs. accumulation
- SOPR (Spent Output Profit Ratio) - seller profitability
- Realized Cap and HODL waves - long-term holder behavior
- MVRV-Z Score - market cycle positioning
- Net outflows from exchanges preceding accumulation phases
- FOMC meetings and Federal Reserve rate decisions
- CPI, PCE, and NFP releases - inflation and employment data
- ECB and BoJ rate decisions - global liquidity signals
- Global M2 growth trend changes
- DXY (U.S. Dollar Index) movements
- Spot ETF inflows/outflows (BlackRock IBIT, Fidelity, Ark)
- Fund disclosures and corporate BTC balance sheet updates
- SEC, CFTC, and FinCEN regulatory commentary
- MiCA/ESMA implementation progress in Europe
- New ETF approvals or expansions to additional markets
- Next halving (~2028) - supply dynamics
- Taproot-related protocol developments
- Lightning Network growth (channels, liquidity, active nodes)
- BTCFi ecosystem expansion and Layer 2 adoption
- Hash rate trends and miner consolidation
Conclusion
Bitcoin in 2025 is a different animal from the one that last made headlines at $60,000 in 2021. The infrastructure around it - regulated ETFs holding nearly a million coins, corporate treasury allocations, a global compliance framework taking shape - represents a structural shift that prior cycles lacked. The supply side has never been tighter: below 0.85% annual inflation, over 70% of coins classified as illiquid, exchange balances at their lowest in five years. The demand side, for the first time, includes a persistent institutional bid that doesn't evaporate with sentiment.
None of that makes Bitcoin immune to drawdowns. It remains a highly macro-sensitive asset that will reprice sharply if the global liquidity environment turns hostile or if a regulatory event forces institutional hands. The base case - measured adoption with continued cycles - remains the most probable path. Bitcoin will likely continue to mature within its cyclical framework rather than transcend it entirely.
What the data argues against is the thesis that Bitcoin's institutional moment is a temporary phenomenon or a market misunderstanding that will be corrected. The on-chain evidence - accumulation behavior, exchange outflows, HODL wave composition - points to coins moving from weaker hands into stronger ones at a rate that has historically preceded extended appreciation. The structural case is intact. The timing, as always, is the variable that no model fully resolves.
PolyMarkets Investment Strategies, Market Research, October 2025