I'll be honest - every January I sit down to write one of these and think "this year is different." And every year it actually is, just not in the ways anyone predicted twelve months earlier. So here we are in 2026: U.S. equities cruising toward a third straight year of double-digit gains, AI spending blowing past even the optimists' numbers, rates grinding lower at a pace that frustrates both bulls and bears, and enough geopolitical noise to make reading headlines feel like a part-time job that doesn't pay. You don't need another "hot stocks" list. What you need is a framework - one that helps you figure out where returns actually come from this year, which themes have staying power versus which ones are just fashionable, and how to build a portfolio that captures the upside without getting destroyed in the three or four scenarios where things go sideways.
We're drawing on outlook research from Nuveen, Fidelity's sector portfolio managers, and Oppenheimer Asset Management here. Equities, fixed income, real estate, infrastructure - we cover them all in depth, with the AI supercycle running through everything like rebar through concrete. Then we finish with a practical framework for turning analysis into actual portfolio decisions. Not a trading plan. A conviction map. The kind of thing that separates investors who have a process from investors who have a Robinhood account and a gut feeling.
One theme keeps surfacing: the barbell. Pair growth positions in tech and AI with defensive anchors - dividend growers, infrastructure, selective fixed income. In a market trading at these multiples with genuine uncertainty on both sides, that balance isn't timidity. It's precision.
The 2026 Macro Backdrop - What You Are Investing Into
Before you put a single dollar to work, get the macro picture straight. Growth, inflation, rates, policy - these set the table for everything else. Here's the consensus and the variables worth actually watching.
The baseline from major asset managers heading into 2026 is cautiously bullish. The U.S. economy keeps defying recession calls that have been wrong every year since 2022 - GDP running around 2%, which is nothing spectacular but it's not a contraction either. The real positive surprise has been corporate earnings. The S&P 500 delivered roughly $275 in earnings per share in 2025, and Oppenheimer forecasts $305 for 2026. Run that through their target P/E of 26.5x and you get a year-end S&P price target of 8,100 - about 15% above where the index closed 2025. Will markets get there in a straight line? Of course not. But the earnings trajectory points up, and that's what matters over any 12-month window.
The Fed has been deliberately slowing its rate cuts - 100 basis points in 2024, only 75 in 2025, and markets are pricing in more of the same measured pace rather than some aggressive new easing cycle. Inflation is the handbrake. Core PCE should moderate toward 2.7% by year-end but that's still above the 2% target, so the central bank stays reactive, not proactive. The 10-year Treasury? Widely expected to end 2026 in the 4.00-4.25% range. Above pre-pandemic norms, sure, but stable enough to avoid the kind of repricing chaos that wrecked portfolios in late 2022.
| Macro Variable | 2025 Actual | 2026 Consensus View | Key Risk |
|---|---|---|---|
| U.S. GDP Growth | ~2.8% | ~2.0% - resilient but moderating | Labor market softening faster than expected |
| Core PCE Inflation | ~2.8% | ~2.7% - sticky above target | Re-acceleration from tariffs or commodity shocks |
| Federal Funds Rate | ~4.25–4.50% | Gradual cuts; ~3.75–4.00% by year-end | Fed pauses if inflation stalls |
| 10-Year Treasury Yield | ~4.6% | 4.00–4.25% range-bound | Fiscal deficit concerns push yields higher |
| S&P 500 EPS | ~$275 | ~$305 (+11% growth) | Margin compression from higher labour costs |
| U.S. Dollar (DXY) | Strong | Modest weakening expected | Safe-haven demand if geopolitical risk spikes |
Here's a tailwind people keep underestimating: fiscal stimulus. The Big Beautiful Bill, ongoing defence spending increases, CHIPS Act implementation, IRA infrastructure provisions - there is a multi-year government spending floor under this economy that offsets a good chunk of private sector caution. And that spending shows up directly in earnings. Industrials, defence contractors, semiconductor equipment companies - they are literally billing the federal government. Follow the invoices.
The AI Supercycle - The Theme That Runs Through Everything
You can't write an honest 2026 outlook without putting AI at the center. This isn't just a tech sector story anymore. It's reshaping capital expenditure patterns, power demand, labour markets, and corporate strategy across all eleven GICS sectors at once. Ignore it at your own expense.
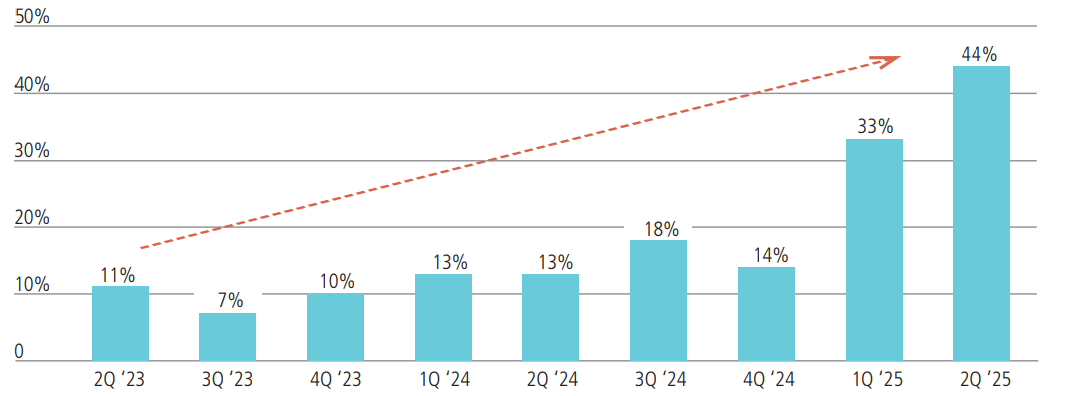
The numbers here aren't ambiguous. Hyperscaler capex on AI infrastructure - data centres, GPUs, high-bandwidth memory, networking gear, and the power systems to run all of it - has been accelerating for nearly three years. From 7% year-over-year growth in Q3 2023 to 44% by Q2 2025. And this isn't some bubble inflated by future promises. Real hardware. Real facilities. Real workloads generating real revenue for the companies deploying it. Microsoft, Google, Amazon, and Meta collectively committed to spending more than $300 billion on AI infrastructure in 2025 alone. Further increases guided for 2026. I want to repeat that number because people glaze over it: three hundred billion dollars. In a single year. From four companies.
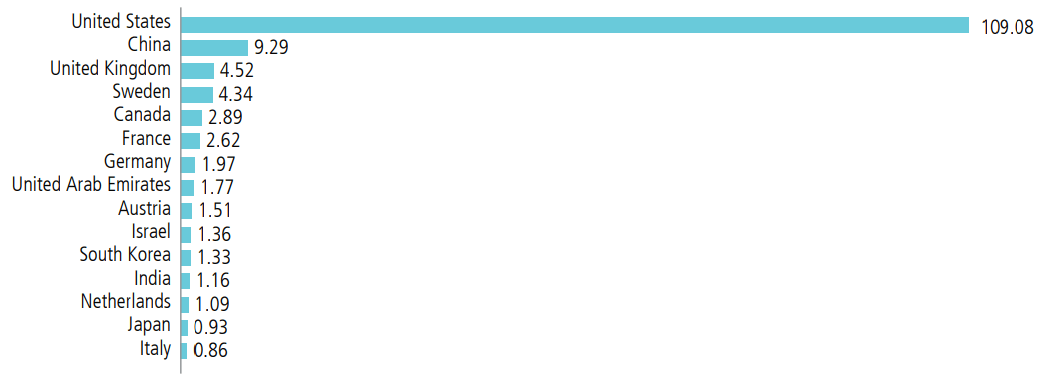
The U.S. lead isn't just about spending volume - it reflects a structural advantage across the entire AI stack. Chip design: Nvidia, Broadcom, AMD. Cloud infrastructure: AWS, Azure, GCP. Frontier model development: OpenAI, Anthropic, Google DeepMind. Enterprise deployment: Salesforce, ServiceNow, Microsoft 365. China's $9.3 billion is not trivial, but U.S. export controls on advanced semiconductors (particularly H100-class GPUs) are a genuine chokepoint. That divergence probably widens through 2026, not narrows.
So where does the money actually flow? The AI supercycle creates identifiable beneficiaries across multiple asset classes:
- Semiconductors & equipment: Nvidia (GPUs), TSMC (advanced node fabrication), ASML (EUV lithography), Applied Materials, Lam Research - the equipment backbone of AI hardware.
- Cloud infrastructure: Microsoft Azure, Amazon AWS, Google Cloud - the platforms charging per-token, per-API-call, and per-compute-hour for AI workloads.
- Electric utilities: Data centres consume enormous amounts of electricity. A single hyperscale AI data centre can require 100–200 megawatts of continuous power - equivalent to a mid-sized city. Utilities with grid positions near major tech corridors (Virginia, Texas, Arizona) are seeing demand growth not seen in decades.
- Industrial machinery: Heavy electrical equipment producers - particularly large gas turbine manufacturers - are supply-constrained against surging power demand that cannot wait for new renewable capacity to come online.
- Real estate: Data centre REITs (Equinix, Digital Realty) are directly tied to AI infrastructure demand. Industrial logistics REITs benefit from the hardware supply chain. Medical office and senior housing are AI-adjacent through healthcare cost efficiency improvements.
Fidelity's tech sector manager Adam Benjamin put it bluntly: he sees no prospect of AI spending flagging. GPUs, high-speed memory, data centres - they remain the infrastructure layer for successive waves of model improvement through 2026 and well beyond. But here's the part most investors miss. Fidelity's industrials manager Clayton Pfannenstiel points out that the U.S. has underinvested in power production for decades. Gas-fired turbines are the bridge - the fastest way to add dispatchable capacity while renewables scale. And the supply constraint on large gas turbines is so severe that order backlogs stretch years into the future. You can't buy a GE Vernova turbine off the shelf. You get in line.
Equities - The Barbell Strategy for 2026
Nuveen and Oppenheimer both land in the same place: neutral-to-constructive on equities, but with a strong bias toward selectivity over blanket market exposure. AI-adjacent valuations give pause. The solution isn't avoidance though - it's balance.
The barbell is how this view becomes a portfolio. One end: growth. U.S. tech, AI infrastructure, financials benefiting from deregulation. The other end: shock absorbers. Infrastructure companies, dividend growers, quality mid-caps that got left behind during the AI momentum rally and now trade at multiples that actually make sense. You need both. The growth side earns returns in the good years. The defensive side keeps you from panic-selling in the bad ones. (And the bad ones always come - the question is just whether you're prepared when they do.)
U.S. large cap still wins the relative preference. Tech dominance, favourable tax policy, deregulation that's especially good for financials - the structural bias toward U.S. large cap hasn't gone away. But small and mid-caps got absolutely left behind during the momentum rally. The quality names in that space - strong balance sheets, manageable debt loads, real pricing power - are trading at multiples that would have been considered cheap three years ago. If you're looking for catch-up trades in 2026, that's a reasonable place to start digging.
Emerging markets? Proceed with caution. Recent performance has been strong, yes. But trade policy uncertainty is the elephant in the room - tariff regimes and export controls can shift with a single executive order, and EM equities are historically the first casualties when U.S. trade policy tightens. Southeast Asian tech manufacturing and Latin American commodity names carry the most exposure. If you hold EM positions, keep them modest. This is not the year to be a hero with emerging market allocation.
Within consumer discretionary, Fidelity's sector manager makes an interesting distinction. The headline risks are real - stubborn inflation, tariff impacts, weakening sentiment. But some industries within discretionary are actually set up for a cyclical lift. Home improvement and furnishings could catch a bid if rate cuts revive housing activity. And discount retailers? They thrive when consumers trade down, which makes them oddly resilient if the macro picture darkens. The Gap selling $12 jeans does fine in a recession. Luxury doesn't.
Fixed Income - Selective Yield-Hunting in a Range-Bound Rate World
Saying "bonds look good" in 2026 is like saying "food tastes nice" - meaningless without specifying which ones. Some segments are richly priced and offer lousy risk/reward. Others look genuinely compelling. The trick is knowing which is which.
U.S. Treasuries: don't expect them to do much. The 10-year is expected to stay range-bound at 4.00-4.25%, which means minimal price appreciation and yields that barely beat a money market fund. If the Fed cuts less than markets expect (a real possibility with inflation still sticky), Treasury prices could actually fall from here. They still serve their role as a flight-to-safety hedge - when everything else is crashing, you'll be glad you own some. But as a source of income or alpha? Not this year.
Investment grade corporate credit: the spreads are telling you something. IG spreads are near multi-decade tights, meaning the extra yield above Treasuries is paper-thin. Think about what that implies: limited upside if spreads tighten further (they can't tighten much more), meaningful downside if a credit event or risk-off episode blows them out. The math is asymmetric, and not in your favour. Nuveen's fixed income team holds only neutral exposure. I'd lean underweight.
Senior loans and CLOs: this is where the yield actually lives. Senior secured loans sit at the top of the capital structure - first-priority claims on assets - and they're currently yielding 7-9% on a floating-rate basis. Floating rate means minimal duration risk. Collateralised Loan Obligations (CLOs) package pools of these loans into tranches, letting you dial the risk/return profile up or down. If you want income without betting on the direction of interest rates, this is the most attractive corner of fixed income right now. Not the sexiest trade. But a good one.
CMBS: strong fundamentals hiding behind a bad reputation. Commercial real estate went through a brutal adjustment from 2022 to 2024, and the securities backed by those properties still carry the scars in their spreads - wider than the broader credit market, which means you're being compensated for complexity and the lingering perception that "commercial real estate is broken." It isn't. Not all of it, anyway. The sub-sectors with genuine demand - industrial logistics, data centres, multifamily housing - have solid fundamentals. The discount reflects yesterday's panic, not today's reality.
Municipal bonds: Nuveen's top fixed income pick for a reason. Munis are tax-exempt at the federal level (often state and local too), which makes the after-tax yield extremely attractive if you're in a top bracket. The sweet spot is the 7-11 year duration range on the upward-sloping muni yield curve - best combination of yield pickup and duration management. State and local government finances are in good shape post-pandemic, though you should keep an eye on federal budget impacts on healthcare funding and higher education endowments. For tax-sensitive investors, the case for munis heading into 2026 is as strong as I've seen in years.
Real Estate - Early Recovery, Demographic Tailwinds & Data Centre Demand
Real estate looks like it's turned a corner. After the brutal 2022-2023 correction, prices are stabilising and in select pockets, recovering. But "real estate" is not one trade - the opportunity is wildly sub-sector-specific. Some segments are still structurally broken. Others have multi-year tailwinds that most equity investors aren't even tracking.
Senior housing is the highest-conviction play in real estate right now. Fidelity's Steve Buller frames it simply: constrained supply meeting the most reliable demographic force in investing. The 75+ age cohort - primary occupants of senior housing - is growing at its fastest rate in history as boomers push through their mid-to-late seventies. You can't argue with demographics. Meanwhile, new construction has been declining for years because development financing got expensive during the rate cycle. Low vacancy, long average stays, limited new supply. That's a textbook setup for pricing power. Welltower (WELL) and Ventas (VTR) are the two dominant REITs with the scale to capture it. This isn't a speculative thesis - it's arithmetic.
Data centre REITs sit at the intersection of real estate and AI. Equinix (EQIX) and Digital Realty (DLR) aren't really traditional real estate companies anymore - they're critical infrastructure providers for the global digital economy. Hyperscalers lease massive colocation and interconnection capacity from both, and AI workloads are driving demand for new campus construction faster than supply can respond. Here's the interesting constraint: it's not capital that limits new data centre development. It's power. REITs that already have power rights secured in high-demand corridors (Northern Virginia, Dallas, Phoenix) are sitting on something close to a monopoly position.
Neighbourhood retail is quietly interesting. Nobody talks about grocery-anchored strip malls at cocktail parties. That's part of the appeal. No one is building new ones (limited supply), local consumer demand is strengthening, and lease structures are tied to inflation. The sub-sector trades at a meaningful discount to industrial and data centre REITs but generates more predictable cash flows than that discount implies. Sometimes the boring trade is the right trade.
Office? Still broken. Remote and hybrid work permanently reduced utilisation rates in most U.S. markets. Lease renewals are negative in nearly every sub-market outside Class A luxury in major financial centres. Unless you're finding an extreme discount on a portfolio of trophy assets in gateway cities with genuine tenant demand, just stay away. Life's too short to own office REITs in 2026.
Rate cuts are the near-term catalyst for the whole sector. REITs carry significant leverage and compete with bonds for yield-seeking capital, so they're inherently rate-sensitive. Every 25-basis-point Fed cut reduces borrowing costs and makes REIT dividend yields look relatively more attractive versus bonds. If the Fed delivers even 75 basis points through 2026, the valuation math on quality REITs improves meaningfully. This is one of those rare situations where you can identify the catalyst in advance and position for it.
Infrastructure & Real Assets - The Structural Decade
Infrastructure is having a moment - and not the kind that fades in a quarter. Surging power demand, digital transformation, the energy transition, and decades of underinvestment in physical networks are all converging at once. This isn't a cyclical trade. It's a structural decade.
Utilities are undergoing something I'd call a generational identity crisis - and I mean that as a compliment. For nearly twenty years, the sector's pitch was boring: stable dividends, regulatory certainty, not growth. Then AI showed up and needed electricity. Lots of it. Fidelity's utilities manager Pranay Kirpalani calls it a once-in-a-generation structural shift, and the numbers back him up. Electrification of everything from cars to heat pumps, manufacturing reshoring, and AI data centre proliferation are all projected to accelerate utility earnings growth over the next five to ten years. The biggest beneficiaries? Utilities with territory in high-growth power demand regions - Texas, Virginia, the Southeast - and those with large renewable portfolios positioned to sign long-term Power Purchase Agreements with hyperscalers desperate for clean energy credits.
Gas turbines are the bridge, and the bridge is sold out. New renewable capacity takes years to permit, build, and connect. In the meantime, the fastest way to add reliable dispatchable power is natural gas - specifically large gas turbines. GE Vernova (GEV), Siemens Energy, and Mitsubishi Power make them. Their order books? Full. Years in advance. This is a supply-constrained, long-cycle industrial business, which is exactly the kind that rewards patient investors. You're not buying a hot tip here. You're buying a multi-year delivery backlog with pricing power baked in.
In private markets, the infrastructure story narrows to three themes: clean energy generation, energy storage, and data centres. Nuveen's team focuses on modern, efficient infrastructure over legacy assets. Natural gas transmission still throws off attractive cash flow, but the terminal value gets murkier as the energy transition progresses. Energy storage - utility-scale batteries, pumped hydro - has moved from niche curiosity to grid necessity. You can't balance intermittent renewables without it, and grid operators know that now. This sub-sector is scaling fast.
Farmland: the allocation nobody talks about. Zero correlation to equity markets. Genuine inflation hedging - crop prices and land values tend to rise with inflation. Almost nobody owns it in their portfolio, which is partly why the return characteristics are so attractive. The catch in 2026: row crop margins (corn, soybeans, wheat) are moderating after the 2022-2023 commodity spike, so this is a patience play, not a quick trade. Permanent crops - almonds, pistachios, citrus - have better near-term margins given tighter supply dynamics. But in either case, farmland is for the investor who thinks in decades, not quarters.
2026 Sector Conviction Dashboard - 11 Sectors Rated
Here's the Fidelity sector manager views and Nuveen's asset class positioning compressed into one dashboard. Directional read for the year, not a trading signal - conviction can flip fast when macro conditions shift.
Conviction ratings synthesised from Fidelity sector portfolio manager outlooks and Nuveen Global Investment Committee positioning. "High Conviction Positive" = clear structural tailwind with attractive entry. "Positive" = constructive view, selective exposure recommended. "Neutral" = balanced risk/reward; stock selection matters more than sector allocation.
Utilities at the top is the most contrarian call on this list - and that's exactly why I like it. For all of 2023-2025, the sector was everybody's afterthought. Sleepy regulated bond proxy. Boring. Then data centres started consuming electricity like small countries, and suddenly utility earnings growth looks like something out of a tech stock presentation. But here is what's interesting: many of these names still trade at traditional utility multiples. The market hasn't fully caught up to the fact that NextEra and Vistra are growing earnings at rates the sector hasn't seen in decades. That gap - between what the growth actually is and what the multiple says the market thinks it is - is where the alpha lives.
Risk Register - Four Scenarios That Could Derail the Outlook
Every bullish thesis needs an honest accounting of what kills it. These four risks aren't tail scenarios you can file away and forget - they're plausible base-case deviations that could materially impact your portfolio this year.
| Risk | Trigger / Driver | Portfolio Impact | Hedge / Response |
|---|---|---|---|
| Inflation Re-acceleration | Tariff-driven goods price increases; commodity supply shock; tight labour market persists | Fed pauses or reverses cuts. Long duration bonds sell off. Growth stocks reprice on higher discount rates. Consumer discretionary hit by margin squeeze. | TIPS, energy/commodity exposure, short-duration credit, inflation-linked infrastructure income |
| AI Investment Disappointment | Hyperscalers cite ROI uncertainty; AI monetisation lags capex; competition erodes pricing power | Nvidia, Broadcom, TSMC trade off sharply. Cloud valuations compress. Utilities lose their new growth narrative. Broader tech multiple contraction. | Size positions based on earnings, not narrative; maintain defensive income positions as counterweight |
| Labour Market Deterioration | Unemployment rises above 4.5%; consumer credit stress builds; corporate hiring freezes spread | Consumer discretionary revenues fall; Financials face rising loan defaults; small-cap stress. Bull case for defensives and rate cuts. | Overweight consumer staples, healthcare, utilities; reduce consumer discretionary; shift fixed income to shorter duration |
| Geopolitical Escalation | Taiwan Strait tensions; Middle East conflict expansion; trade war intensification | Risk-off repricing globally. Energy spike. EM equities hit hardest. Supply chain disruption for semiconductor and industrial companies reliant on Asian manufacturing. | Gold, energy exposure, U.S. Treasuries as safe haven; reduce EM exposure; avoid Taiwan-dependent semiconductor plays |
Will all four hit at once? Almost certainly not. But even one of them landing hard would change the 2026 playbook significantly. The point isn't to predict which risk materialises - it's to have a pre-planned response so you're not making portfolio decisions in a panic at 3am while futures are limit-down. And notice something: the barbell framework we keep coming back to provides natural insurance against several of these risks simultaneously. The defensive income side holds up if inflation re-accelerates or the labour market cracks. The quality bias in equity selection reduces your exposure to an AI-bubble scenario. Geographic diversification provides some geopolitical buffer. You don't need to predict the crisis. You need to survive it with your portfolio intact.
Building Your 2026 Portfolio - The Practical Framework
Analysis without action is just entertainment. Here's how to turn everything above into actual portfolio decisions - starting with account structure (the part most people skip) and finishing with position sizing (the part most people get wrong).
Step 1: Get the account structure right before picking a single investment. I cannot stress this enough. Tax efficiency compounds exactly like investment returns, except it's guaranteed. The right accounts holding the right assets can add 0.5-1.5% per year in after-tax return without taking one additional unit of risk. That's free money. And yet most investors just throw everything into a taxable brokerage account and wonder why their tax bill is so high.
| Account Type | Best For | 2026 Limits / Notes |
|---|---|---|
| 401(k) / 403(b) | High-growth equities - defer tax on gains until retirement | $24,500 limit; always capture employer match first |
| Roth IRA | Highest-growth, highest-risk positions - tax-free compounding for decades | $7,500 limit; income eligibility caps apply |
| SEP IRA / Solo 401(k) | Self-employed investors seeking maximum tax-deferred capacity | Up to $70,000 total contribution |
| Taxable Brokerage | Tax-efficient assets: ETFs, buy-and-hold equities, municipal bonds | Capital gains + dividend taxes apply annually - hold munis here for tax efficiency |
| HSA (Health Savings) | Healthcare-related equities - triple tax advantage is the most tax-efficient account available | $4,300 individual / $8,550 family (2026) |
Step 2: Apply the barbell. I'm not going to give you a specific percentage split because that depends on your time horizon, risk tolerance, and what you already own. But the directional logic applies broadly:
- Growth sleeve (40–60% of equities for long-horizon investors): U.S. large-cap tech/AI via XLK or individual positions (Nvidia, Microsoft, Broadcom); financials via XLF; quality mid-cap via QMID or individual selection. This is your return engine.
- Defensive/income sleeve (40–60% of equities for long-horizon investors): Infrastructure/utilities via XLU or individual positions (NextEra, GE Vernova); dividend growers via VIG or DGRO; senior housing REITs (Welltower, Ventas). This is your shock absorber.
- Fixed income (size based on time horizon): Municipal bonds 7–11yr duration (preferred by Nuveen); senior loans/CLOs for floating-rate income; minimal Treasuries except as a hedge. Avoid IG corporate at current tight spreads.
- Real assets (5–10% for most portfolios): Infrastructure ETF (IFRA); data centre REITs (EQIX, DLR); farmland via public REIT (FPI) or private fund if eligible. This provides inflation protection and low equity correlation.
Step 3: Size positions based on what you actually know, not what Twitter thinks. Here's the discipline that separates real portfolio managers from speculators: for every position, you should be able to answer three questions. What are the earnings going to be in 12-24 months? What multiple should those earnings trade at? What's my downside if I'm wrong? If you can't answer all three, your position is too large. Full stop. This sounds obvious. In practice, almost nobody does it - they size based on conviction about the narrative, not the numbers. And narrative conviction is just enthusiasm with a better vocabulary.
Markets in 2026 will test conviction. Count on it. Valuations are high enough that corrections will feel dramatic when they come - and they will come. The geopolitical and macro risks are real enough that there will be weeks where uncertainty seems to outweigh every fundamental argument you can make. In those moments, the investors who hold their best positions through the turbulence are the ones who built portfolios with enough defensive ballast to absorb the drawdown without being forced to sell. That's not market-timing. That's portfolio construction. And frankly, it is the single most important skill you can develop as an investor - more important than stock-picking, more important than sector analysis, more important than reading every research note that crosses your desk.
Research, PolyMarket Investment Strategies, February 2026