Consider PREMIUM MEMBERSHIP to get upfront access to undiscovered trends shaping future markets - and success to make informed decisions. Unsubscribe anytime.
Market Tips with detailed scenario analysis and research
Scenario analysis, research breakdowns and respective target zones
Industry & sector research with full fundamental & technical analysis
We've sent you a confirmation email. Click the link to activate your free access.
Something went wrong. Please try again.
Education - Sector Analysis
11 Stock Market Sectors: GICS Breakdown for Investors
Stock Market Sectors
January 2026 31 min read Beginner
▶ Analyst Note - Sector Fundamentals
Quick quiz. Why is Amazon classified as a Consumer Discretionary company and not a Technology company? Why does the utilities sector trade like a bond wearing a stock costume? Why is Visa in Financials while PayPal sits in Information Technology? If you can't answer those off the top of your head, you're not alone - but you should be able to. These classification quirks aren't trivia. They are the scaffolding underneath every professional portfolio construction conversation happening on Wall Street right now.
This course walks through the Global Industry Classification Standard - GICS - all eleven sectors, each with its own economic logic, its own catalysts, and its own place in the business cycle. By the end, you won't just know what each sector contains. You'll understand why it behaves the way it does. And that understanding is what lets you build a portfolio with intention rather than guesswork.
We start at the top - the classification framework itself - then work down to ground level. Which companies sit in which buckets. What economic forces actually drive their revenue. How they tend to perform across the four phases of the cycle. This is the kind of framework that, once you learn it, changes how you read every earnings report and every market headline from that point forward.
- PolyMarkets Education Desk, January 2026
What Is the GICS Classification System?
MSCI and S&P Dow Jones Indices built the Global Industry Classification Standard back in 1999. It's the dominant framework for sorting publicly listed companies into comparable peer groups - and when a professional says "sector," this is the system they're referring to. Everything else is just loose talk.
Before GICS existed, classification was a mess. Analysts in London, New York, and Tokyo all sorted companies differently, which made cross-border comparisons borderline useless. GICS fixed that with a four-tier hierarchy and precise, globally applied rules about where every company belongs. One company, one classification. No ambiguity.
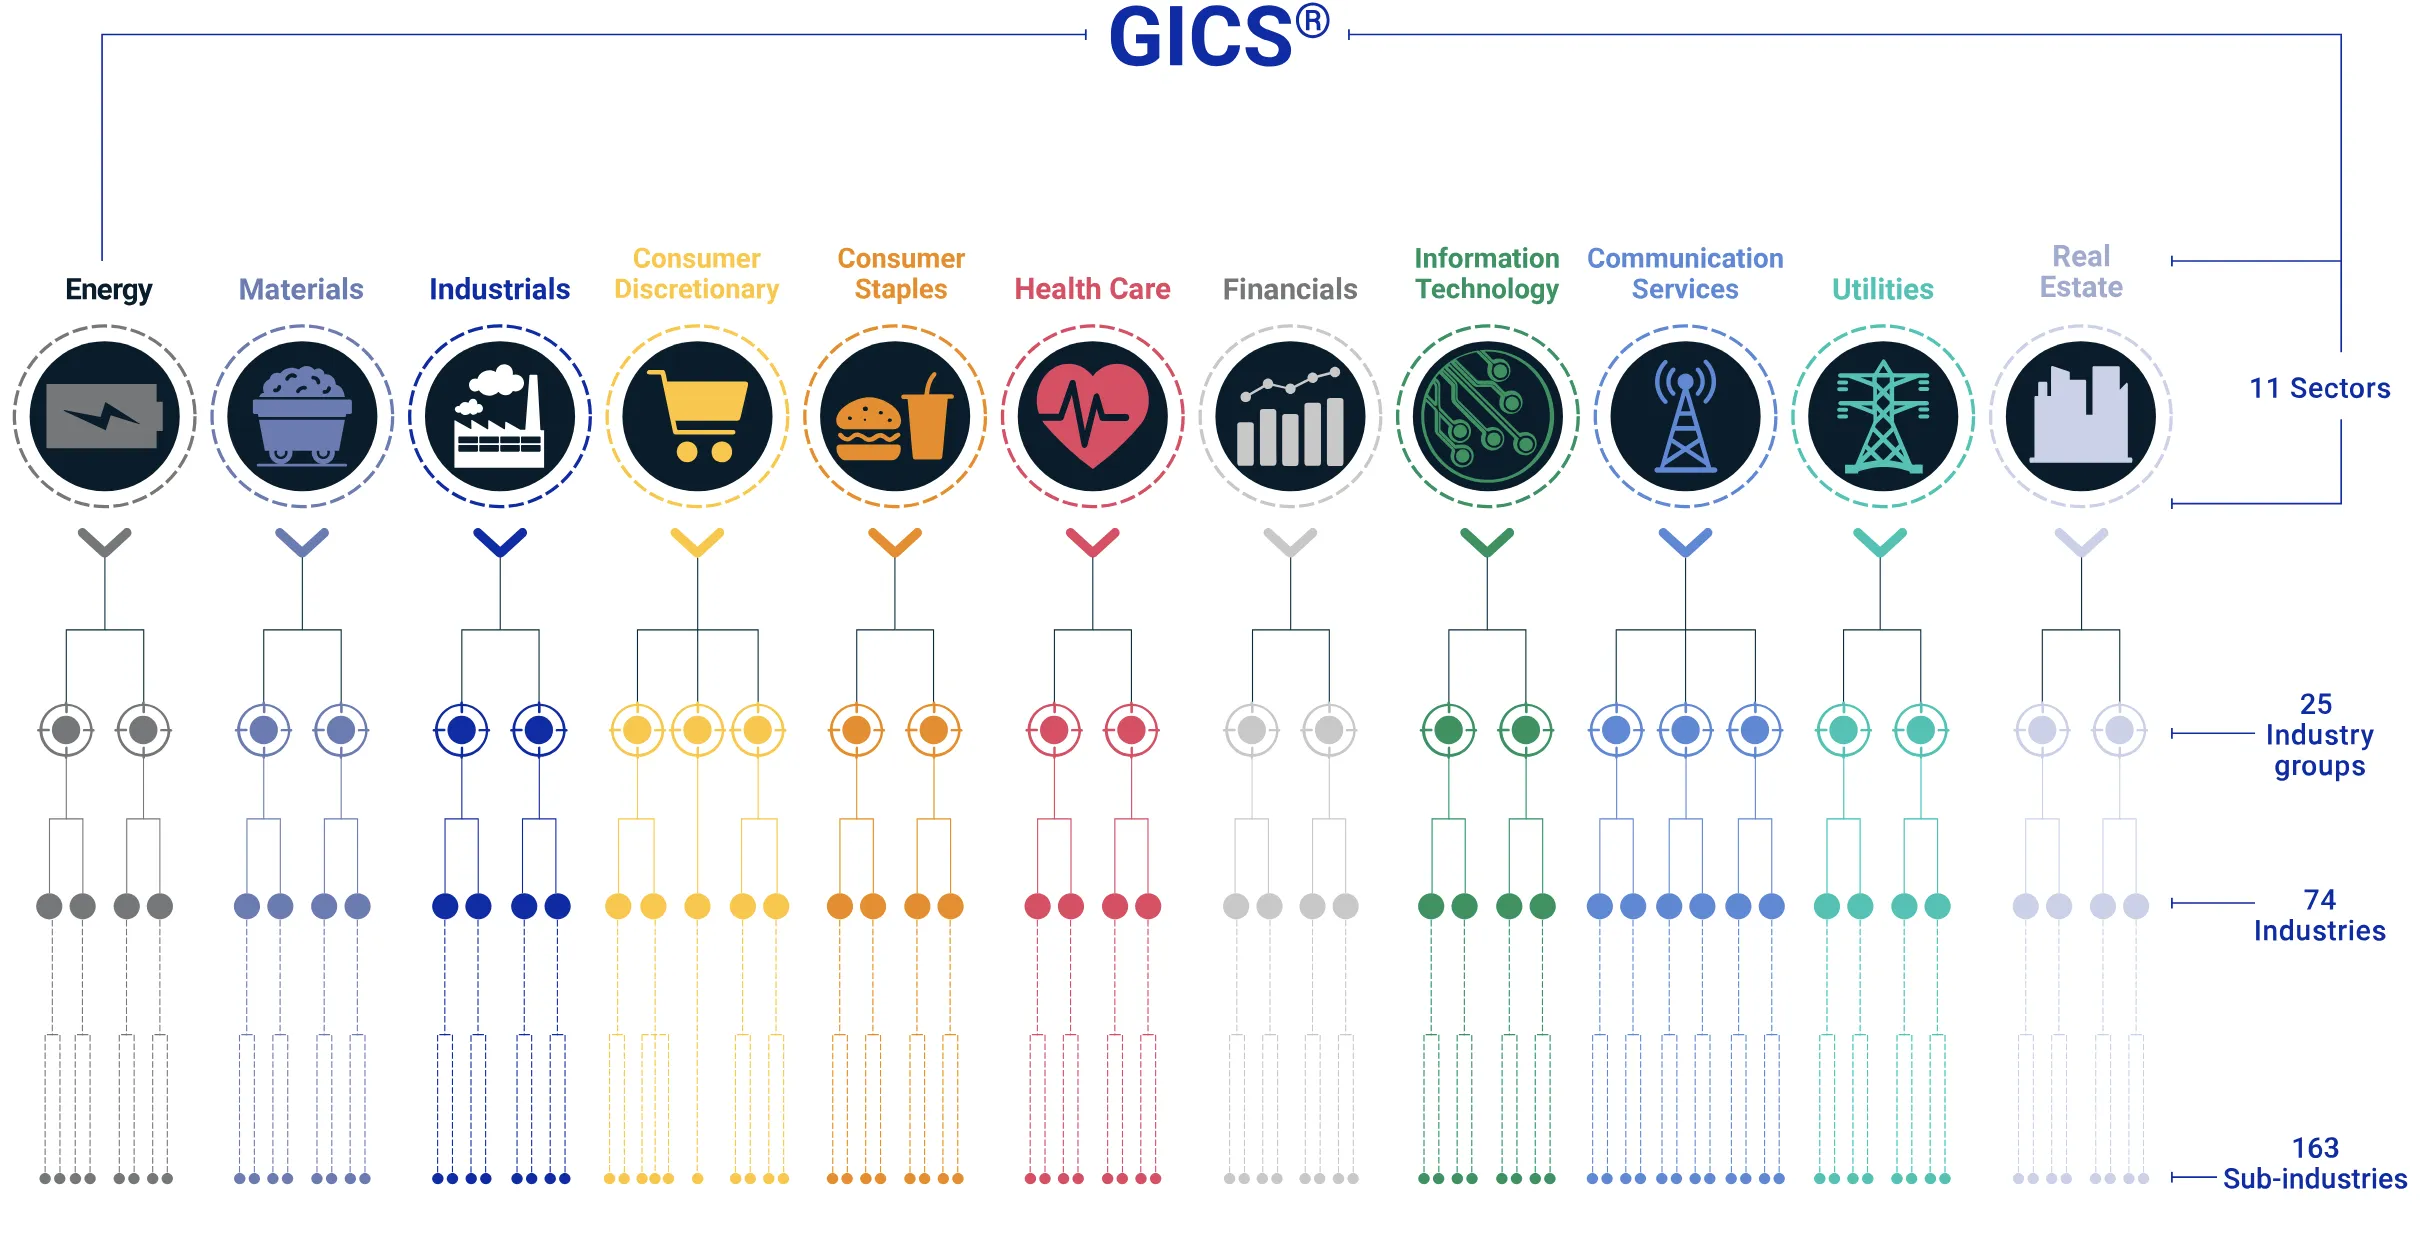
GICS Hierarchy: 11 Sectors → 25 Industry Groups → 74 Industries → 163 Sub-industries. Every publicly listed company sits in exactly one sub-industry. Source: MSCI / S&P Dow Jones Indices
The four tiers work like a funnel. At the broadest level: 11 Sectors - these are the buckets people mean when they say "I like tech" or "I'm underweight energy." Below that: 25 Industry Groups, which break sectors into more specific themes (Financials contains Banks, Diversified Financials, Insurance, and Real Estate Finance as separate groups). Third tier: 74 Industries - this is where Integrated Oil & Gas splits from Oil & Gas Exploration & Production within Energy. And at the bottom, 163 Sub-industries provide the most precise classification of what a company actually does day to day.
GICS gets updated periodically, and the reshuffles can be dramatic. The biggest recent one came in 2018, when Google and Facebook got pulled out of Technology and Consumer Discretionary and dropped into a newly reconstituted Communication Services sector. One reclassification, and suddenly the composition of two major sectors changed overnight. Useful reminder: these boundaries aren't carved in stone. They evolve as the economy evolves. (And they create genuine portfolio consequences when they shift - if your mandate says "overweight Tech," losing Google to another sector changes what that mandate actually means.)
Classification Quirks to Know: Amazon is in Consumer Discretionary, not Technology - because its primary revenue source has historically been retail. Tesla is also Consumer Discretionary, not Industrials - it's classified as an auto manufacturer. PayPal sits in Information Technology (IT Services), while Visa and Mastercard are in Financials. None of this is intuitive. All of it matters when you're analysing sector performance data.
The 11 GICS Sectors at a Glance
Your top-level map of the market. Eleven sectors, each with its S&P 500 weight, primary ETF, and character type. The exact numbers shift over time, but the relative proportions and behavioural profiles stay remarkably stable across cycles.
⛽Energy
Cyclical
~4% of S&P 500
ETF: XLE · XOP
⛏️Materials
Cyclical
~2.5% of S&P 500
ETF: XLB · GDX
✈️Industrials
Cyclical
~8% of S&P 500
ETF: XLI · ITA
🏦Financials
Cyclical
~14% of S&P 500
ETF: XLF · KRE
🛍️Consumer Disc.
Cyclical
~10% of S&P 500
ETF: XLY
💻Info. Technology
Growth
~31% of S&P 500
ETF: XLK · SOXX · IGV
📡Comm. Services
Mixed
~9% of S&P 500
ETF: XLC
💊Healthcare
Defensive-Growth
~11% of S&P 500
ETF: XLV · IBB
🛒Consumer Staples
Defensive
~6% of S&P 500
ETF: XLP
⚡Utilities
Defensive
~2.5% of S&P 500
ETF: XLU
🏢Real Estate
Defensive-Yield
~2.5% of S&P 500
ETF: XLRE · VNQ
Weights approximate as of early 2026 and shift with market performance. Note that IT alone represents nearly one-third of the entire index - a concentration level with significant implications for "diversified" index investors.
Cyclical vs. Defensive - The Most Important Distinction
Before you study individual sectors, internalise one distinction that professional investors use every single day: cyclical versus defensive. This is the master key. Everything else is a footnote.
A cyclical sector rides the economy up and down. Expansion means more spending, more investment, more commodity demand - cyclical companies eat well. Contraction reverses it all with equal brutality. Energy, Materials, Industrials, Financials, Consumer Discretionary, and (to a large extent) Information Technology are all cyclical. When the economy is humming, these are the sectors printing money. When it's not, they're the ones getting destroyed.
A defensive sector barely flinches regardless of economic conditions. The products aren't optional - people still need electricity, food, medicine, and a roof over their heads during a recession. Consumer Staples, Healthcare, and Utilities are the classic defensive trio. Real Estate is the odd one out: defensive in character (income-generating assets with steady demand) but heavily rate-sensitive (leverage-loaded balance sheets that get squeezed when the Fed tightens). It lives in both worlds simultaneously, which is part of what makes it interesting - and confusing.
Characteristic
Cyclical Sectors
Defensive Sectors
Revenue in recession
Falls sharply - often 20–40% peak-to-trough
Barely moves - typically flat or mild decline
Bull market performance
Often leads the market - can double or triple
Lags the market - single-digit gains in strong years
Dividend profile
Lower, variable - can be cut in downturns
Higher, stable - dividends are core to the value proposition
Valuation sensitivity to rates
Mixed - banks benefit from rising rates; tech hates them
High - utilities and REITs trade like bonds; compete for yield
Typical beta vs. S&P 500
Above 1.0 - amplifies market moves
Below 1.0 - dampens market moves
Best economic phase
Early-to-mid expansion: recovery and growth
Late cycle and recession: slowing growth, risk-off
The Portfolio Implication: Load up on cyclicals and you'll feel like a genius in a bull market - and lose 40-50% in a bear market wondering what happened. All defensives? You'll sleep well but dramatically underperform in any long expansion. The professional approach is a deliberate mix, tilted based on where you think the cycle sits. This is portfolio management, not stock-picking. Different skill entirely.
The Raw-Materials Cyclicals - Energy, Materials & Industrials
This is where the physical economy lives. Energy powers everything. Materials build everything. Industrials move everything. All three track the global growth cycle with uncomfortable precision - and all three are particularly sensitive to what's happening in China, the world's largest consumer of industrial commodities by a wide margin.
⛽Energy
~4% of S&P 500CyclicalXLEXOPOIH
Energy covers the entire hydrocarbon supply chain. Upstream companies (exploration and production) find and extract oil and gas. Midstream operators run the pipelines and storage. Refiners (downstream) convert crude into gasoline, diesel, and petrochemicals. Oilfield service companies provide the equipment and expertise drillers need - think of them as the arms dealers of the oil patch. Then you've got the integrated majors like ExxonMobil and Chevron, which do all of it simultaneously. Top holdings: ExxonMobil (XOM), Chevron (CVX), ConocoPhillips (COP), EOG Resources.
Primary drivers: Oil price. Full stop. Brent crude and Henry Hub natural gas are the variables that matter most - a $10/barrel swing in oil can move sector earnings 20% or more. Beyond that: OPEC+ production discipline, U.S. shale output growth, Chinese demand (~15% of global consumption), and geopolitical risk premiums from Middle East tensions and sanctions regimes. The energy transition is a genuine long-term headwind as electrification gradually erodes fossil fuel demand. But here's the counterpoint: underinvestment in new production capacity since 2015 has created structural supply constraints that could keep prices elevated through the late 2020s. The death of oil has been greatly exaggerated.
✗ Struggles when: Recession cuts demand, renewable energy scales faster than expected, OPEC raises production quotas, strong dollar pressures commodity prices.
⛏️Materials
~2.5% of S&P 500CyclicalXLBGDXCOPX
Materials supplies the building blocks of the physical economy. Chemical producers (Linde, Air Products, Dow, LyondellBasell), miners extracting copper, gold, silver, lithium, and nickel (Freeport-McMoRan, Newmont, Alcoa), steel and aluminium producers (Nucor, Steel Dynamics), packaging companies (Sealed Air, Packaging Corporation). Small by S&P weight - just 2.5% - but it punches well above that in economic signalling. Commodity prices are often the earliest tell for where the business cycle is heading. When copper rallies, something is being built somewhere. When it crashes, construction is dying.
Primary drivers: Global industrial production and construction activity are the big ones. But the energy transition has added a structural demand layer that wasn't there a decade ago - an EV requires 3-4x more copper than an internal combustion vehicle, batteries need lithium and cobalt, wind turbines need rare earth elements. China's PMI data is the single most watched indicator because China consumes roughly 50-55% of the world's industrial metals. When China's PMI drops below 50, materials stocks feel it within days. Gold miners are a special case entirely - they track gold prices, which are driven by real interest rates and safe-haven demand, not industrial activity. Different animal.
✓ Shines when: Global growth accelerating, infrastructure spending surging, green energy buildout driving copper/lithium demand, weak U.S. dollar (commodities priced in USD become cheaper for buyers holding other currencies).
✗ Struggles when: Chinese economy slows, recession cuts construction and manufacturing activity, commodity supply gluts develop, strong dollar crushes prices.
✈️Industrials
~8% of S&P 500CyclicalXLIITAAIRR
Industrials is the broadest sector by company count - it covers essentially everything that keeps the physical economy moving and defended. Aerospace and defence (RTX, GE Aerospace, Boeing, Lockheed Martin, Northrop Grumman) is the highest-profile sub-sector, benefiting from elevated NATO budgets and the post-COVID aircraft demand recovery. Transportation and logistics (Union Pacific, CSX, UPS, FedEx) are the arteries of global commerce - when shipping volumes drop, you're looking at a slowdown in real time. Heavy equipment (Caterpillar, Deere, Parker Hannifin) makes the machines that build and farm. Building systems (Honeywell, Johnson Controls, Carrier) run the infrastructure inside structures. All of these businesses are deeply embedded in capex cycles at both corporate and government levels, which is why Industrials tends to be a late confirmation of economic direction rather than an early signal.
Primary drivers: Capex cycles. When corporations and governments are investing in new capacity, Industrials win. When they freeze spending, Industrials suffers. U.S. and European defence spending is an outsized driver for the A&D sub-sector - European rearmament since 2022 has been a powerful catalyst that still has years to run. Global trade volumes drive the transportation names. And the government stimulus trifecta - CHIPS Act, Infrastructure Investment and Jobs Act, Inflation Reduction Act - collectively directed hundreds of billions toward industrial activity, generating multi-year order backlogs that provide earnings visibility even if the broader cycle softens. That backlog is something investors tend to underappreciate.
✓ Shines when: Economy in expansion, capex investment high, defence spending rising, infrastructure spending programmes active, global trade volumes growing.
✗ Struggles when: Recession causes corporate capex freezes, trade war tariffs reduce shipping volumes, government spending cuts hit defence budgets, supply chain disruptions increase costs.
The Growth & Finance Cyclicals - Financials, Consumer Discretionary, IT & Communication Services
These four sectors are the market's growth engine. Combined, they account for well over half the S&P 500 - which means this is where most of the alpha lives. And most of the drawdown risk. Each has its own economic logic, but all four are sensitive to the credit cycle and investor risk appetite.
🏦Financials
~14% of S&P 500CyclicalXLFKREKBE
Financials prices, allocates, and insures money. Commercial banks (JPMorgan Chase, Bank of America, Wells Fargo, Citigroup) make money the old-fashioned way - the spread between what they pay depositors and what they charge borrowers. Investment banks (Goldman Sachs, Morgan Stanley) earn fees from capital markets activity: IPOs, debt underwriting, M&A advisory. Insurance companies (Berkshire Hathaway, Chubb, AIG) collect premiums and invest the float. Asset managers (BlackRock, State Street, T. Rowe Price) take a percentage of assets under management - the more the market goes up, the more they earn, which is a nice business model if you can get it. Payment networks (Visa, Mastercard) earn transaction fees and carry no credit risk - they're often mistaken for banks but they're really toll booths. Regional banks (PNC, US Bancorp, Truist) are the most rate-sensitive sub-group in the sector.
Primary drivers: The yield curve. Nothing else comes close for banks. A steep curve (long rates well above short rates) lets banks borrow cheap short-term and lend profitably long-term - net interest margins expand and earnings surge. When the curve inverts, as it did in 2022-2023, that carry trade collapses and bank earnings get compressed. Loan default rates are the other major variable - rising unemployment drives loan loss provisions higher, eating directly into profits. For investment banks, it's M&A volumes and equity issuance conditions. For insurers, catastrophe losses and investment yield environments. Each sub-group within Financials responds to different stimuli, which is why the sector can look misleadingly calm in aggregate when individual pieces are in turmoil.
✗ Struggles when: Yield curve inverts, credit cycle turns and defaults rise, regulatory capital requirements tighten, fintech disruption compresses fee structures, catastrophe losses spike for insurers.
🛍️Consumer Discretionary
~10% of S&P 500CyclicalXLYFDIS
Consumer Discretionary is the "wants, not needs" sector - the stuff people defer buying the moment financial stress appears. It spans an enormous range: online retail (Amazon is the single largest holding - and yes, it lives here, not in Tech), vehicles both electric and traditional (Tesla, GM, Ford, Toyota), luxury goods (Estee Lauder, PVH), restaurants (McDonald's, Starbucks, Chipotle, Yum!), hotels and casinos (Marriott, Hilton, MGM), and apparel (Nike, Lululemon, Gap). The diversity means the sector rarely moves uniformly. Amazon's e-commerce dominance and Tesla's EV cycle can drag the sector's headline number in one direction while traditional retailers are getting crushed in the other.
Primary drivers: Jobs and wages. When people have paycheques growing faster than inflation, they spend on discretionary goods. When they don't, they cut the gym membership and cancel the vacation. Consumer confidence surveys (Michigan, Conference Board) are useful leading indicators. Credit access matters hugely for big-ticket items - higher car loan rates directly reduce auto demand, which is why the Fed's rate decisions ripple through this sector faster than almost any other. Amazon's quarterly results have become a de facto proxy for overall U.S. retail health, given the company's sheer scale.
✓ Shines when: Low unemployment, strong wage growth, consumer confidence at cycle highs, credit accessible, interest rates falling (cheaper auto loans and credit cards).
Information Technology is the 800-pound gorilla. At roughly 31% of the S&P 500, its performance dominates the index more than any other sector - not even close. Semiconductors (Nvidia, Broadcom, Intel, Qualcomm, Applied Materials, ASML, and TSMC as a Taiwan-listed proxy), software (Microsoft, Salesforce, Adobe, ServiceNow, Oracle), hardware (Apple, Dell, HP), and IT services (Accenture, Cognizant, Gartner). The AI revolution that began in earnest in 2022-2023 turned this sector into the centre of gravity for global capital markets. Nvidia's market cap went from roughly $300 billion to over $3 trillion in less than three years. Just sit with that number for a moment. Three years, ten times the value. That's what a genuine demand supercycle looks like when it meets a near-monopoly position in the supply chain.
Primary drivers: AI infrastructure buildout is the dominant theme right now - hyperscale capex from Microsoft, Amazon, Google, and Meta is the primary demand driver for semis and data centre hardware. Enterprise software spending tracks IT budget cycles and is relatively resilient, though not immune to cost-cutting in a downturn. The structural risk? Interest rates. Tech companies are priced on long-dated future cash flows, so higher discount rates mechanically compress valuations. That's why the 2022 hiking cycle hit growth tech so hard - going from 0% to 5% short rates is mathematically brutal when you're trading at 30-50x earnings. The semiconductor cycle (historically 3-5 years from boom to bust to boom) adds another layer of volatility that catches people off guard if they're not paying attention.
✓ Shines when: AI and cloud adoption accelerating, rates stable or falling, enterprise IT budgets expanding, semiconductor cycle in upcycle.
✗ Struggles when: Rates rise sharply (long-duration valuation compression), enterprise IT budget freezes, semiconductor inventory correction, regulatory pressure on big tech (antitrust, data privacy).
📡Communication Services
~9% of S&P 500MixedXLCFCOM
Communication Services is the Frankenstein sector - stitched together by the 2018 reclassification from parts that don't naturally belong together. At the top: the digital advertising duopoly, Alphabet (Google Search, YouTube) and Meta (Facebook, Instagram, WhatsApp), which together make up the majority of the sector's market cap and basically just sell eyeballs to advertisers. Then the streamers: Netflix, Disney, Warner Bros. Discovery, Paramount - entertainment companies fighting a brutal content spending war. And finally the telecom carriers: Verizon, AT&T, T-Mobile - stable, low-growth cash flow machines that sell wireless subscriptions. Three completely different business models crammed into one sector. You genuinely need to analyse them as three separate groups because they behave nothing alike across the cycle.
Primary drivers: For the ad giants (Alphabet, Meta), it's total advertising spend - which tracks corporate revenue growth and is one of the first budget lines slashed when the economy softens. AI monetisation is the new growth vector: Google weaving AI into search, Meta using AI to improve ad targeting, both companies starting to sell AI tools directly. For streamers, it's subscriber growth, content quality, and the shift toward ad-supported tiers (which is basically an admission that pure subscription growth has a ceiling). For telecom, pricing power on wireless plans and 5G investment cycles. Telecom is slow-growth, high-dividend, defensive-adjacent - the boring anchor within an otherwise cyclical sector.
✓ Shines when: Digital ad market strong, AI monetisation progresses for platforms, streaming subscriber growth beats expectations, telecom pricing power intact.
The Defensive Pillars - Healthcare, Staples, Utilities & Real Estate
When the economic outlook darkens, this is where capital hides. Lower upside in bull markets, dramatically lower downside in bear markets. But "defensive" is not one thing - each of these four sectors has its own quirks, and treating them as interchangeable is a mistake that costs money.
💊Healthcare
~11% of S&P 500Defensive-GrowthXLVIBBXBI
Healthcare is the most complex defensive sector because it's really four different businesses sharing a label. Pharma companies (Eli Lilly, Pfizer, J&J, AbbVie, Merck) develop and sell drugs with 20-year patent protection - a beautiful business model until the patent expires and revenues fall off a cliff as generics flood in. Medical device makers (Abbott, Medtronic, Boston Scientific, Intuitive Surgical) produce surgical equipment, implantables, and diagnostics. Health insurers (UnitedHealth, Elevance Health, Cigna, Humana) manage costs for millions of members. And biotech (Amgen, Regeneron, Moderna, Vertex) develops novel therapies - smaller biotechs are some of the most binary bets in public markets, with individual stocks moving 50-80% on a single FDA decision. Up or down. The GLP-1 obesity drug wave - Ozempic, Wegovy from Novo Nordisk, Mounjaro and Zepbound from Eli Lilly - completely rewrote the sector narrative from 2023 to 2025, pushing Lilly past $700 billion in market cap.
Primary drivers: FDA approval pipelines are the main event-driven catalyst - a single approval or rejection can move billions in market cap overnight. Patent cliffs create predictable headwinds: when AbbVie's Humira lost exclusivity in 2023, the company needed its pipeline to plug an $18 billion annual revenue hole. That's not a headwind. That's a chasm. Ageing demographics are the structural tailwind - the over-65 population consumes healthcare at 4-5x the rate of the under-40 cohort, and that wave is accelerating. Drug pricing policy is the perpetual political risk; any credible legislative threat sends the sector into a crouch. But the defensive character is real. People don't stop taking blood pressure medication because the S&P is down 20%. They don't defer cancer treatment because GDP contracted.
✓ Shines when: Recession fears mount (defensive rotation), landmark drug approvals materialise, ageing demographics drive volume, drug pricing legislation fails in Congress.
✗ Struggles when: Drug pricing reform passes, major patent cliffs hit without pipeline replacement, biotech clinical trial failures cascade across sub-sector, M&A regulatory scrutiny increases.
🛒Consumer Staples
~6% of S&P 500DefensiveXLPFSTA
Consumer Staples is the textbook defensive sector. These businesses sell what people buy no matter what the economy is doing. Food and beverage (Coca-Cola, PepsiCo, Nestle, Mondelez, General Mills, Kraft Heinz). Household and personal care (Procter & Gamble, Unilever, Colgate-Palmolive, Kimberly-Clark) - the cleaning, hygiene, and grooming products that show up in every home whether GDP is up or down. Tobacco (Altria, Philip Morris International), which continues to generate staggering cash flows from cigarettes while pivoting to reduced-risk products. And wholesale/retail staples (Costco, Walmart) providing the distribution infrastructure. The common thread: demand barely flinches during recessions. People still buy toilet paper in a downturn. They still drink Coca-Cola. These are among the most recession-proof revenue streams in public markets.
Primary drivers: Pricing power. That's the operational variable that separates great consumer brands from mediocre ones - can they raise prices faster than input cost inflation (grain, palm oil, packaging, energy) without losing volume to store brands? Procter & Gamble can. A second-tier brand often can't. Population growth in emerging markets (Asia, Africa) provides a structural volume tailwind. The secular headwind: private label competition. Costco's Kirkland and Walmart's Great Value keep getting better, and consumers are increasingly willing to trade down. The sector's relative performance is essentially counter-cyclical - when risk appetite is high and the market is ripping, Staples consistently lag. When the economy cracks, they shine. You own them for the bad years, not the good ones.
✓ Shines when: Recession fears mounting, equity volatility spiking, investors rotating to safety and dividends, emerging market consumption growing.
✗ Struggles when: Growth stocks surging in risk-on bull market, private labels eroding pricing power, commodity input costs surging faster than pricing, currency headwinds for global brands.
⚡Utilities
~2.5% of S&P 500DefensiveXLUFUTY
Utilities run the infrastructure that powers modern life: electric generation and distribution (NextEra Energy, Duke Energy, Southern Company, Dominion Energy, Consolidated Edison), natural gas distribution, water treatment, and increasingly, renewable power generation. The defining characteristic: these are regulated monopolies. They operate under government-approved rate structures that guarantee a predictable return on assets in exchange for accepting price controls. Cash flows are extraordinarily stable and predictable as a result. Dividends are the primary return driver - average utility yields 3-5% in a normal rate environment. For years, that was the whole story. Boring. Reliable. Then AI data centres showed up needing electricity like a small city, and suddenly utilities with grid positions near major tech corridors (Virginia, Texas, Arizona) are seeing demand growth they haven't experienced in decades. The sector's identity is shifting in real time.
Primary drivers: Interest rates. When rates rise, utilities get hit from two directions at once: debt servicing costs increase on their substantial bond portfolios, and their dividend yields become less attractive relative to government bonds, causing capital to rotate out. The bond relationship is so strong that professionals literally call utilities an "equity bond proxy." State public utility commissions set allowed rates of return, which determines how much utilities can earn on their asset base - it's a regulated ceiling on profitability, which sounds bad until you realise it's also a floor. Weather is an operational driver (extreme heat or cold spikes consumption and tests grid reliability). And the renewable energy transition is a multi-decade investment theme - trillions being spent on solar, wind, and grid modernisation. That's a lot of rate base growth ahead.
✓ Shines when: Interest rates falling, recession fears elevated, investors seeking yield and stability, data centre electricity demand creating unexpected growth catalysts.
✗ Struggles when: Rates rise sharply (bonds become more attractive alternatives), growth stocks surge (capital exits bond proxies), regulatory decisions reduce allowed returns, capital-intensive energy transition dilutes near-term earnings.
🏢Real Estate
~2.5% of S&P 500Defensive-YieldXLREVNQIYR
Real Estate got split from Financials in 2016, and it's dominated by REITs - Real Estate Investment Trusts. The legal structure requires distributing at least 90% of taxable income as dividends and deriving at least 75% of gross income from real estate. High yield by design. What surprises most people is how diverse the sector actually is. Industrial logistics REITs (Prologis - warehouses for e-commerce fulfilment). Cell tower REITs (American Tower, Crown Castle - wireless infrastructure). Data centre REITs (Equinix, Digital Realty - the physical backbone of cloud and AI). Healthcare facilities (Welltower, Ventas). Residential apartments (AvalonBay, Equity Residential). Malls (Simon Property Group). Office. Self-storage. Each sub-sector has completely different demand drivers. The blanket label "Real Estate" hides more variation than probably any other sector in the index.
Primary drivers: Interest rates. REITs carry 40-60% debt on their balance sheets, so rising rates hit them harder than almost any other sector - borrowing costs increase while dividend yields become less competitive versus bonds. It's a double whammy. Operational drivers are occupancy rates, same-property rental growth, and lease renewal spreads. But the sub-sector dynamics are what really matter: data centre REITs trade on AI infrastructure demand and are genuine growth stories. Office REITs face a structural headwind from remote work that's probably permanent. Industrial/logistics REITs (Prologis) ride the e-commerce wave. Cell tower REITs generate inflation-linked recurring revenue from wireless carrier leases. Same sector, completely different investment theses.
✓ Shines when: Rates falling (debt cheaper, dividend yields more attractive), occupancy high, data centre and logistics demand growing, inflation (raises rental prices on lease renewals).
✗ Struggles when: Rates rise sharply (refinancing costs surge, bond alternatives more attractive), office vacancies mounting, credit conditions tighten (development financing harder to source), cap rate expansion compresses asset values.
Sector Rotation - Following the Four Phases of the Cycle
Professional portfolio managers don't hold every sector equally at all times. They rotate - deliberately over- or underweighting sectors based on where the economy sits in its cycle. Once you learn this framework, you'll read financial news differently. Permanently.
The economic cycle has four recognisable phases, and each phase creates a predictable leadership pattern across sectors. I want to emphasise "predictable" - not "guaranteed." These tendencies are real and statistically meaningful over long horizons, but every individual cycle has quirks that confound the textbook model. The 2020-2021 cycle compressed multiple phases into months. The 2022-2023 cycle saw Energy outperform during rate hikes because of geopolitical supply shocks, not traditional demand dynamics. So treat this as a strong prior. Not a rigid rule. Not a trading system.
Economic Phase
Sectors That Lead
Sectors That Lag
Macro Logic
Early Expansion Recovery: GDP recovering, rates low, credit expanding
Financials, Consumer Discretionary, Real Estate, Industrials
Utilities, Consumer Staples
Credit conditions ease, consumers regain confidence, businesses begin reinvesting. Defensive safe havens are no longer needed - capital rotates to risk.
Mid Expansion Growth: GDP strong, rates rising moderately, earnings surging
Information Technology, Industrials, Materials, Energy
Utilities, Real Estate
Corporate earnings surge broadly. Capex cycles fully engaged. Rising rates begin to squeeze rate-sensitive sectors. Commodity demand rising with global activity.
Late Cycle Slowdown: Growth fading, rates at peak, inflation sticky
Energy, Materials, Healthcare, Consumer Staples
Consumer Discretionary, Financials, IT
Inflation stays elevated while growth decelerates. Commodity supply tightness benefits Energy and Materials. Consumers pull back on discretionary spending. Yield curve flattens or inverts - bad for banks. Growth stocks reprice on higher discount rates.
Recession / Contraction Downturn: GDP falling, rates being cut, unemployment rising
Non-discretionary demand holds firm. Defensive dividends are prized when capital markets are volatile. Cyclical revenues collapse - loan defaults rise, capex freezes, commodity demand falls, consumers retrench.
Critical Caveat on Rotation: The AI theme of 2023-2025 drove IT leadership even into a moderately tight monetary environment - something the textbook model wouldn't predict. These frameworks describe tendencies, not certainties. Always layer real-world context - geopolitical shocks, policy pivots, sector-specific catalysts like the GLP-1 wave in Healthcare - on top of the cycle model. The map is useful. But the territory always has surprises the map didn't show.
S&P 500 Sector Weights - What You Actually Own in an Index Fund
If you hold SPY, VOO, or IVV, you own all 11 sectors. But your exposure is wildly unequal. Here's where your money actually sits - and the concentration might surprise you.
Sector
S&P 500 Weight
Primary ETF
Largest Holdings
Character
Information Technology
~31%
XLK
Apple, Nvidia, Microsoft, Broadcom
Growth · Rate-sensitive
Financials
~14%
XLF
JPMorgan, Berkshire, Visa, Mastercard
Cyclical · Yield-curve driven
Healthcare
~11%
XLV
UnitedHealth, Eli Lilly, J&J, Abbott
Defensive-Growth · FDA event risk
Consumer Discretionary
~10%
XLY
Amazon, Tesla, Home Depot, McDonald's
Cyclical · Consumer sentiment
Communication Services
~9%
XLC
Alphabet, Meta, Netflix, Verizon
Mixed · Digital ad cycle
Industrials
~8%
XLI
GE Aerospace, RTX, Caterpillar, UPS
Cyclical · Capex-driven
Consumer Staples
~6%
XLP
P&G, Coca-Cola, PepsiCo, Costco
Defensive · Pricing power key
Energy
~4%
XLE
ExxonMobil, Chevron, ConocoPhillips
Cyclical · Commodity-driven
Real Estate
~2.5%
XLRE
Prologis, American Tower, Equinix
Defensive-Yield · Rate-sensitive
Materials
~2.5%
XLB
Linde, Sherwin-Williams, Freeport
Cyclical · China-linked
Utilities
~2.5%
XLU
NextEra, Duke Energy, Southern Co.
Defensive · Bond proxy
Concentration Risk Hidden in Plain Sight: IT at ~31% means nearly one-third of every dollar in a standard S&P index fund sits in a single sector. Add Communication Services at ~9% - where Alphabet and Meta are essentially large-cap tech companies regardless of what GICS calls them - and roughly 40% of your "diversified" index fund is concentrated in one overarching theme. That's not a reason to sell the index. It is a reason to know what you actually own, and to think twice before stacking a tech ETF on top of an existing S&P position. You might be more concentrated than you realise.
Building a Sector-Aware Portfolio - Practical Strategy
You now understand what each sector contains, how it behaves, and where it fits in the cycle. The final step is turning that knowledge into something useful for actual portfolio decisions.
Sector ETFs give you clean, cheap exposure when you have a macro thesis but no stock conviction. Say you believe rates are about to fall and want exposure to rate-sensitive sectors, but you don't have a strong view on which specific utility or REIT will benefit most. A sector ETF solves that. The SPDR Select Sector suite (XLE, XLB, XLI, XLF, XLY, XLP, XLK, XLC, XLV, XLU, XLRE) are the most liquid and widely used. Expense ratios of 0.09-0.13% - cheaper than nearly any actively managed fund. You get the sector bet without the single-stock risk.
Compare valuations within the sector, never against the market average. A 25x P/E is expensive for a bank and cheap for a software company. A 2% dividend yield is low for a utility and high for a pharmaceutical company. The only comparison that means anything is against the sector's own historical median and its direct peers. When you find a company trading at a material discount to sector peers on a relevant metric, that warrants digging. It's either a value opportunity or a signal that the market has identified a structural problem you haven't found yet. Both are worth understanding.
Mix cyclical and defensive. Always. All cyclicals? You'll feel brilliant in a bull market and lose 40-50% in a recession. All defensives? You'll sleep well and dramatically underperform in any long expansion. The professional approach: meaningful positions in both, tilted based on where you think the cycle sits. A practical heuristic: when the yield curve is steepening, PMI is above 50, and earnings revisions are positive - lean cyclical. When the curve inverts, PMI decelerates, and revisions go negative - shift toward defensive. This isn't timing the market. It's adjusting the dial.
Sector flows tell you what institutional money is actually doing. When capital is rotating into Utilities and Staples and out of Consumer Discretionary and Materials - without any obvious fundamental catalyst - that's often an early warning that big money is reducing risk appetite. ETF flow data for XLU and XLP versus XLY and XLB tells a story about where professional managers collectively see the cycle heading. You can track this through ETF.com or most brokerage platforms with flow data. It's one of those signals that's right often enough to be worth watching, even though it's wrong often enough to not be worth trading blindly.
The One-Sentence Framework: Know which sectors are cyclical, which are defensive, where you are in the cycle - then let that guide your overweights and underweights without ever overriding the individual company analysis that remains the foundation of good stock selection.
Sector analysis won't tell you when to buy or sell with precision. No framework does. What it will do is prevent the classic mistake: holding a concentrated cyclical position heading into a recession because you didn't recognise the macro backdrop shifting underneath you. That kind of downside avoidance - just not getting destroyed in the downturns - is often more valuable to long-term wealth than any amount of outperformance in the up years. The maths on this is surprisingly clear: avoiding a 40% loss is more valuable than capturing a 40% gain, because of how compounding works on a depleted base.
The market rotates. Capital moves between sectors constantly, responding to economic conditions, rate expectations, and earnings dynamics. Your job isn't to predict those rotations perfectly - even the professionals get it wrong more than they'd like to admit. Your job is to understand the framework well enough that you're never caught on the wrong side of a major rotation with a position too large to exit gracefully. That's the whole game.
PolyMarket Investment, Research Team, January 2026