I've been watching European natural gas inventories all year, and the chart keeps telling the same story the market refuses to hear. Storage levels have run 10% below the five-year average for twelve consecutive months. Russia, which used to supply roughly 40% of Europe's gas, has been effectively cut off. Asia is competing for the same LNG cargoes. And yet the TTF spot price has actually fallen since the heating season began - down about 12%. That's not fundamentals. That's complacency.
Meanwhile, the company that has quietly become Europe's most important remaining gas supplier is trading at 8.8x forward earnings and paying you nearly 8% to wait. Equinor grew production 7% year-over-year to 2,130 thousand barrels of oil equivalent per day. It generated $14.7 billion in cash flow through nine months. It returned $9 billion to shareholders - a ~15% total yield - while keeping its balance sheet at just 12.2% net debt with $22.4 billion in cash. And the stock has gone roughly nowhere.
I started building this position because I believe the market is making a mistake it has made before: pricing a dual-engine energy company as though both engines are permanently broken. They are not. European gas is structurally tighter than the spot price suggests, and the global oil market may have far less spare capacity than institutional estimates assume. You do not need both of those catalysts to fire for this trade to work - but if they do, the repricing will be significant. At $23.50–$25.50, the margin of safety is exceptional for those willing to look past a quarter or two of soft headline numbers and focus on what is actually happening underneath.
Equinor at a Glance
If you know Equinor only as "that Norwegian oil company," you are already underestimating it. Yes, it's majority-owned by the Norwegian government (67%), headquartered in Stavanger, and it operates across more than 30 countries. But what makes it genuinely interesting - and genuinely different from its peers - is that it is not an oil company or a gas company. It is both, in roughly equal measure, sitting in one of the most geopolitically stable and tax-transparent jurisdictions on earth. In an era of rising resource nationalism, that combination is routinely undervalued.
Think of Equinor as a dual-engine machine. One engine runs on European natural gas - where the company is the continent's dominant remaining supplier. The other runs on crude oil, with world-class fields like Johan Sverdrup producing at near-perfect regularity. There is also a growing, if still modest, renewables portfolio - Dogger Bank offshore wind in the UK, Empire Wind in New York - that positions the company for the energy transition without betting the house on it. That diversification is the key structural advantage that peers like Suncor (oil-heavy) or Cheniere (gas-only) simply cannot replicate.
I keep coming back to the valuation, because it does not make sense to me. At 8.8x forward earnings, Equinor trades at a meaningful discount to both Suncor (13x) and Cheniere (11x) - despite offering a higher dividend yield, more commodity diversification, and superior geopolitical stability. The Norwegian government's majority ownership ensures policy continuity and eliminates the capital allocation volatility that can plague companies with activist shareholders or speculative management. There is no drama here, no empire-building CEO, no shareholder activism. This is a company that does what it says it will do, quarter after quarter. And somehow, it's the cheapest of the three.
The European Gas Thesis - Tighter Than You Think
If I had to pick one chart to explain why I'm buying Equinor, it would be the European natural gas inventory chart below. It tells a story that the spot market has stubbornly refused to acknowledge: Europe is structurally short on gas, and the buffer is thinner than it has been at any point since the energy crisis of 2022.
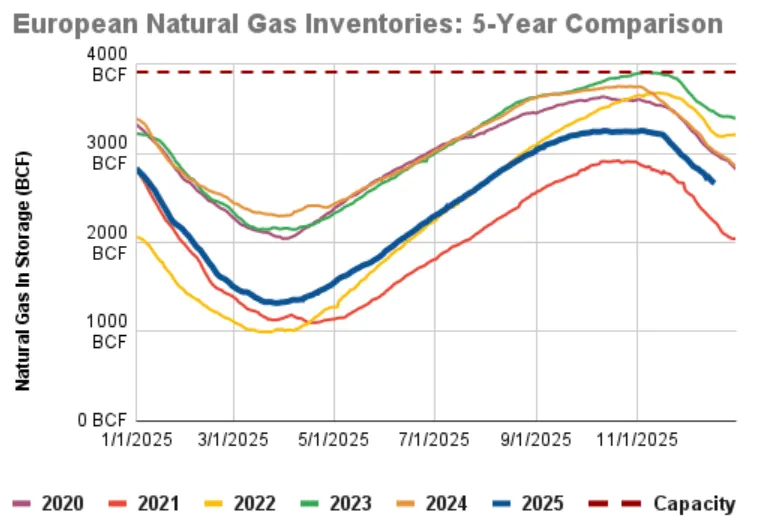
As the chart shows, Europe's natural gas storage levels have been trending below the five-year average for the entire year. We are currently approximately 10% below those levels - not a crisis, but a vulnerability. The storage level heading into winter 2025/2026 sits around 83%, which is 12 percentage points below where it was at the same point last year. As Equinor's CFO Torgrim Reitan noted on the Q3 earnings call: the market seems tighter than many actually think. A cold winter could have a significant impact on pricing.
The classic cold-winter catalyst has not materialised in the early weeks of the 2025-26 heating season - TTF has actually declined roughly 12% since October as temperatures tracked seasonal norms. This is not a defeat for the thesis; it simply means the weather optionality has not been exercised yet. The more durable setup is the structural storage deficit entering the 2026-27 refill season. Storage running approximately 10% below the five-year average means Europe faces a more demanding injection season in spring and summer 2026 - demand for refilling storage at below-average levels provides a more reliable, less weather-dependent price catalyst than any single cold snap. A benign winter does not resolve the structural tightness; it defers but intensifies the repricing pressure.
"In the short term, this winter, the market seems tighter than many actually think. We are on a storage level around 83%, which is 12 percentage points below last year. If we see a cold winter, it can really have a significant impact on the market."
- Torgrim Reitan, Equinor CFO, Q3 2025 Earnings CallThere is also a structural dimension that extends beyond this winter. Russian pipeline gas to Europe has been reduced to a trickle. The potential sanctioning of Russian LNG - approximately 17 billion cubic metres - would further tighten the European market. Meanwhile, new LNG supply from the US and Qatar, while significant, is not arriving as quickly as projected, and Asian demand is growing at approximately 3% per year, competing for the same cargoes. Equinor's cost position - at roughly $2/MMBtu for Norwegian gas delivered into an $11/MMBtu European market - provides an enormous margin of safety regardless of where spot prices settle.
The Oil Wildcard - OPEC+ Spare Capacity Fiction
I want to be upfront about the oil side of the thesis: the consensus narrative is bearish, and for understandable reasons. OPEC+ is adding 2 million barrels per day back into the market. The EIA forecasts persistent oversupply. Prices have drifted down nearly 20% year-to-date. For Equinor, which derives approximately half its revenue from oil-related products and services, this has been a headwind - and it's the main reason the stock has gone nowhere.
But I have been studying OPEC+ spare capacity numbers for some time now, and I think the consensus may be significantly wrong on one critical variable. The EIA estimates over 4 million barrels per day of spare capacity - a number that, if true, would cap oil prices for years. The problem is that this estimate has a poor track record. When the Saudis and OPEC were called upon to stem the oil price surge in 2007–2008 that ended near $150/barrel, the promised spare capacity simply did not materialise. They failed to produce it, because it didn't exist in the quantities they claimed.
There is a telling divergence in how different institutions read the current market. The gap between OPEC's estimate of a modest 0.4 mb/d surplus in Q3 and the EIA's estimate of a 2.5 mb/d glut in the same period is enormous - roughly 2 million barrels per day of disagreement. This is not a rounding error; it is a fundamental dispute about the state of the oil market. The truth is likely somewhere in between, which means the surplus is meaningfully smaller than the bearish consensus assumes.
Here is what this means for the Equinor thesis: the oil market doesn't need to boom for this trade to work. The gas side alone justifies the position. But if the bears are wrong about oil - if OPEC+ has largely exhausted its real spare capacity, if demand continues to grow at approximately 1 mb/d per year, and if the decline in US drilling activity is the market's own way of signalling that current prices are too low - then the oil leg of Equinor's revenue base becomes a powerful bonus catalyst. It's the difference between a solid return and an exceptional one, and the market has not priced in any probability of the upside scenario.
Production Engine - 7% Growth and Counting
One of the things I find most impressive about Equinor - and most overlooked by the market - is that while everyone is debating commodity price direction, the company has been quietly delivering something that few large integrated energy companies can claim: meaningful, organic production growth. Total equity production in Q3 2025 reached 2,130 MBOE per day - up 7% year-over-year - driven by exceptional performance on the Norwegian Continental Shelf and a rapidly scaling US onshore business. This isn't acquired growth. It's operational execution.
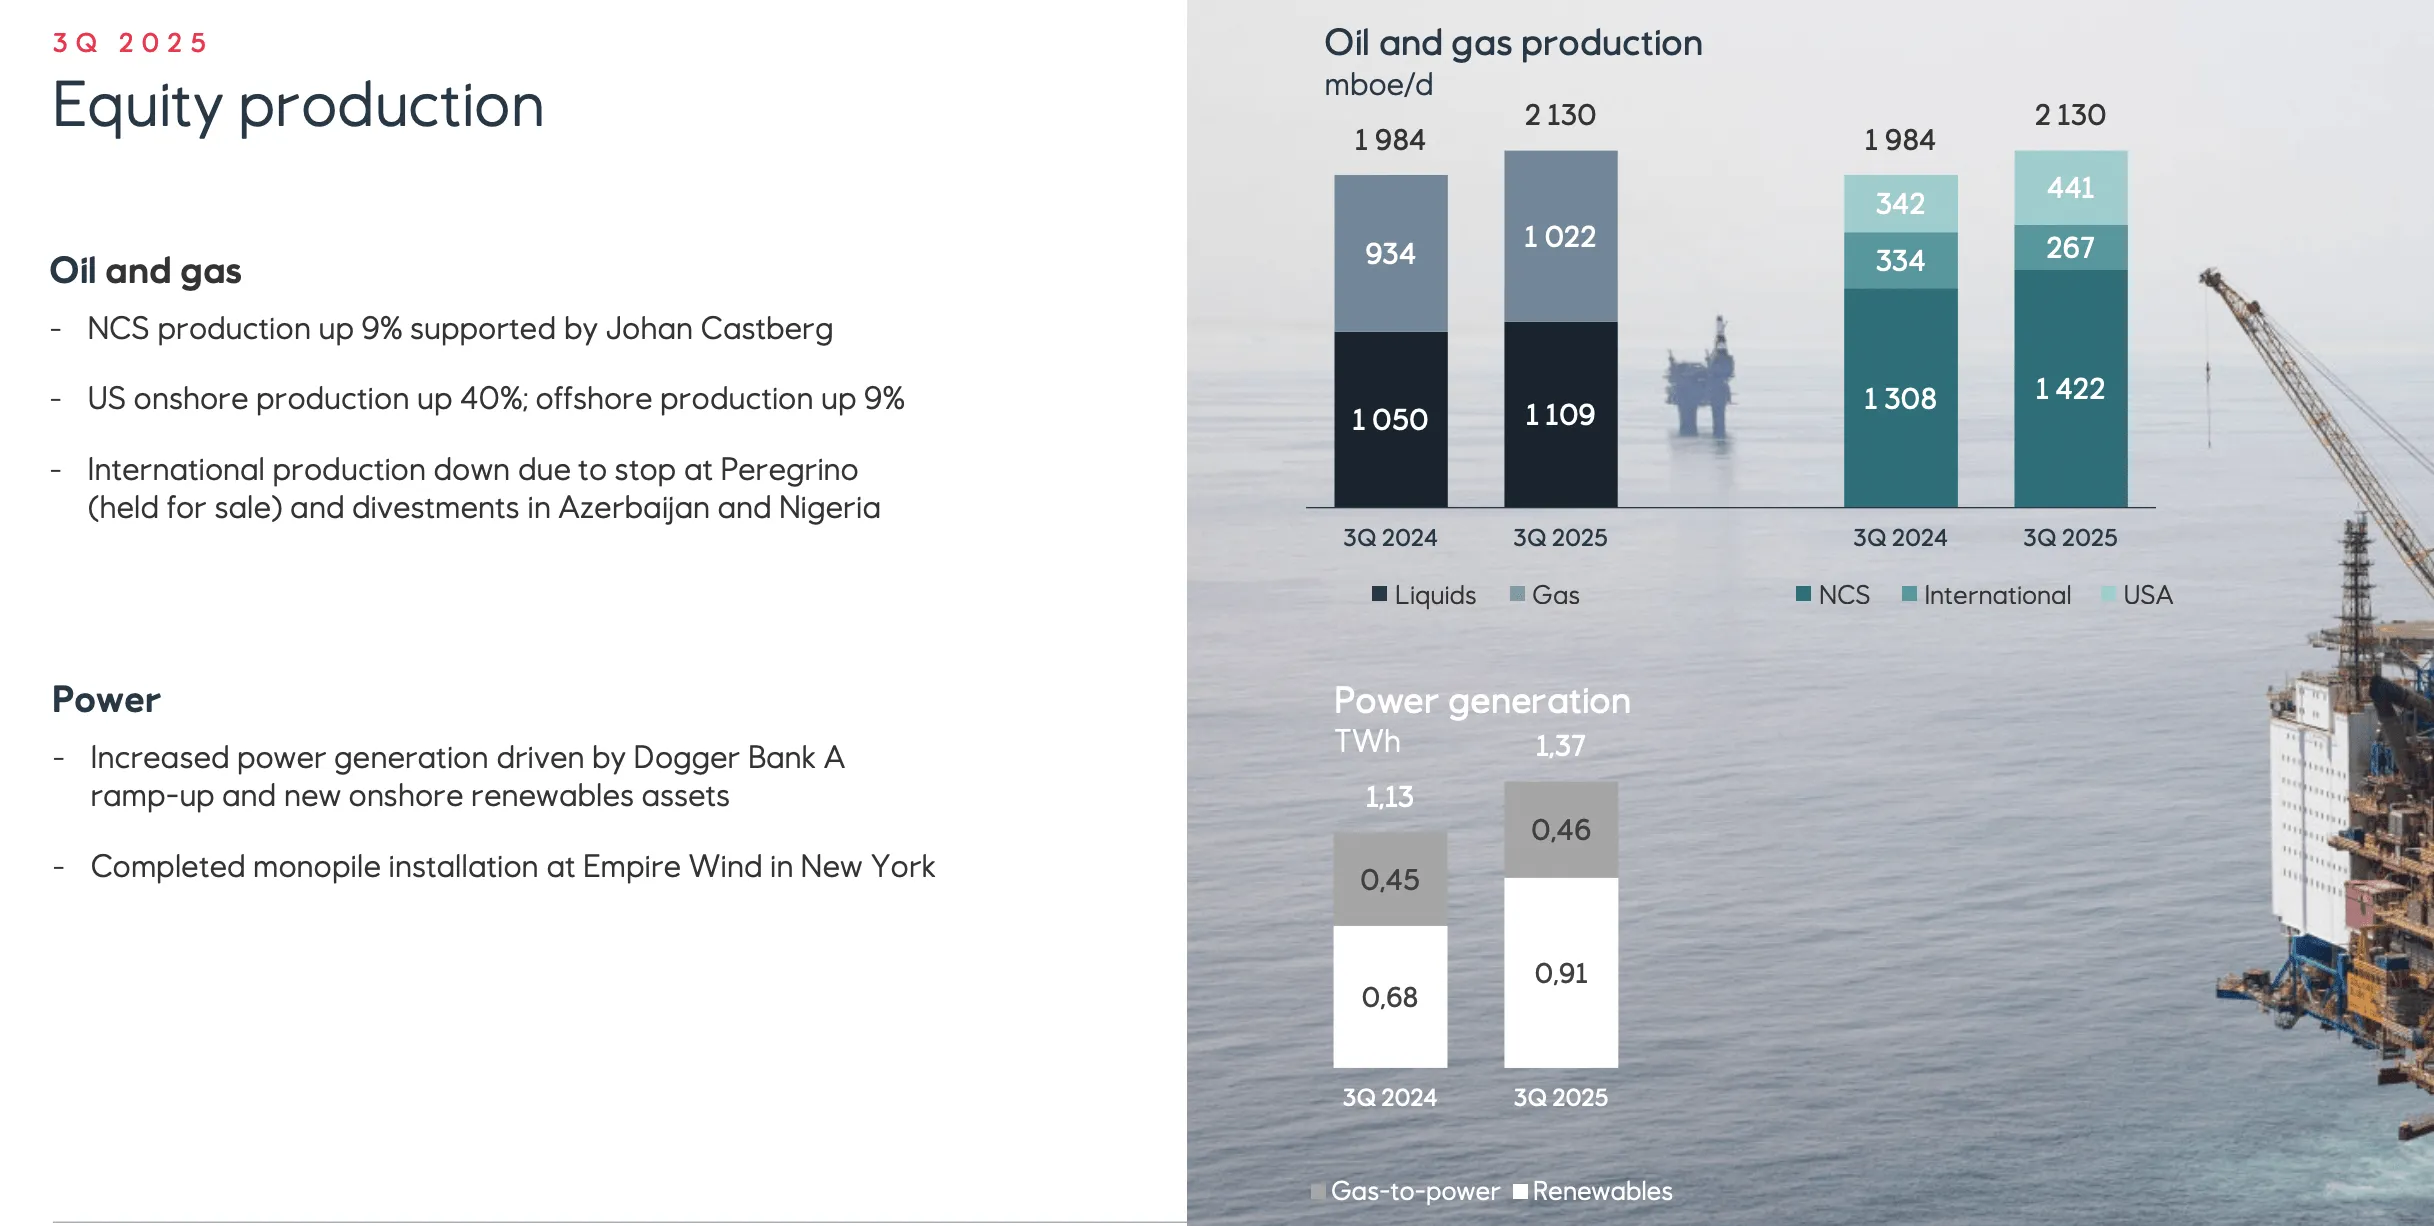
The production growth story is underpinned by three world-class assets. Johan Sverdrup, the largest oil field in the North Sea, delivered close to 100% regularity in Q3 - a remarkable operational achievement for an asset of this scale. Johan Castberg, which came on stream during the summer, is already producing at plateau levels and achieving a $5/barrel premium to Brent crude due to its high-quality crude. And Bacalhau, Equinor's largest international offshore development in Brazil, produced its first oil in October 2025, with production capacity of 220,000 barrels per day and reserves exceeding 1 billion barrels.
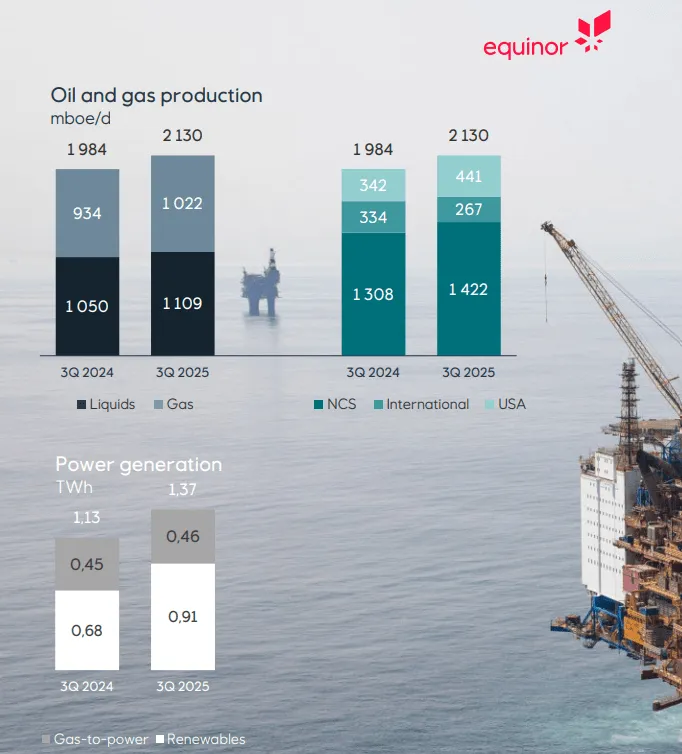
In the US, the picture is equally compelling. US onshore production surged 40% year-over-year following the acquisition of onshore assets in 2024, while offshore production grew 9%. The US segment now represents a meaningful and growing component of Equinor's portfolio, providing geographic diversification beyond the NCS.
On the renewables front, total power generation reached 1.37 TWh in Q3, with the renewable portfolio generating 910 GWh - a 34% increase year-over-year driven by Dogger Bank A in the UK and new onshore renewables assets. Equinor has also taken a more active ownership position in Danish offshore wind developer Orsted, participating in a rights issue at a significant discount and nominating a board candidate. While renewables remain a small portion of earnings today, the strategic positioning is real - and the cost of that positioning has been materially reduced, with renewables operating costs down approximately 50% quarter-over-quarter.
Financial Fortress - Cash Flow, Dividends & Buybacks
When I look at energy companies, I always start with the same question: how much cash is actually coming in the door, and what are they doing with it? In Equinor's case, the answer is reassuring - almost boringly so. Through the first nine months of 2025, cash flow from operations after tax reached $14.7 billion. Even after absorbing $3.9 billion in Norwegian tax installments (Norway's tax regime is punitive but predictable) and $3.4 billion in organic capital expenditure, the company generated enough cash to distribute $5.6 billion to shareholders in Q3 alone. That's not a number that requires creative accounting to arrive at. It's cash in, cash out.
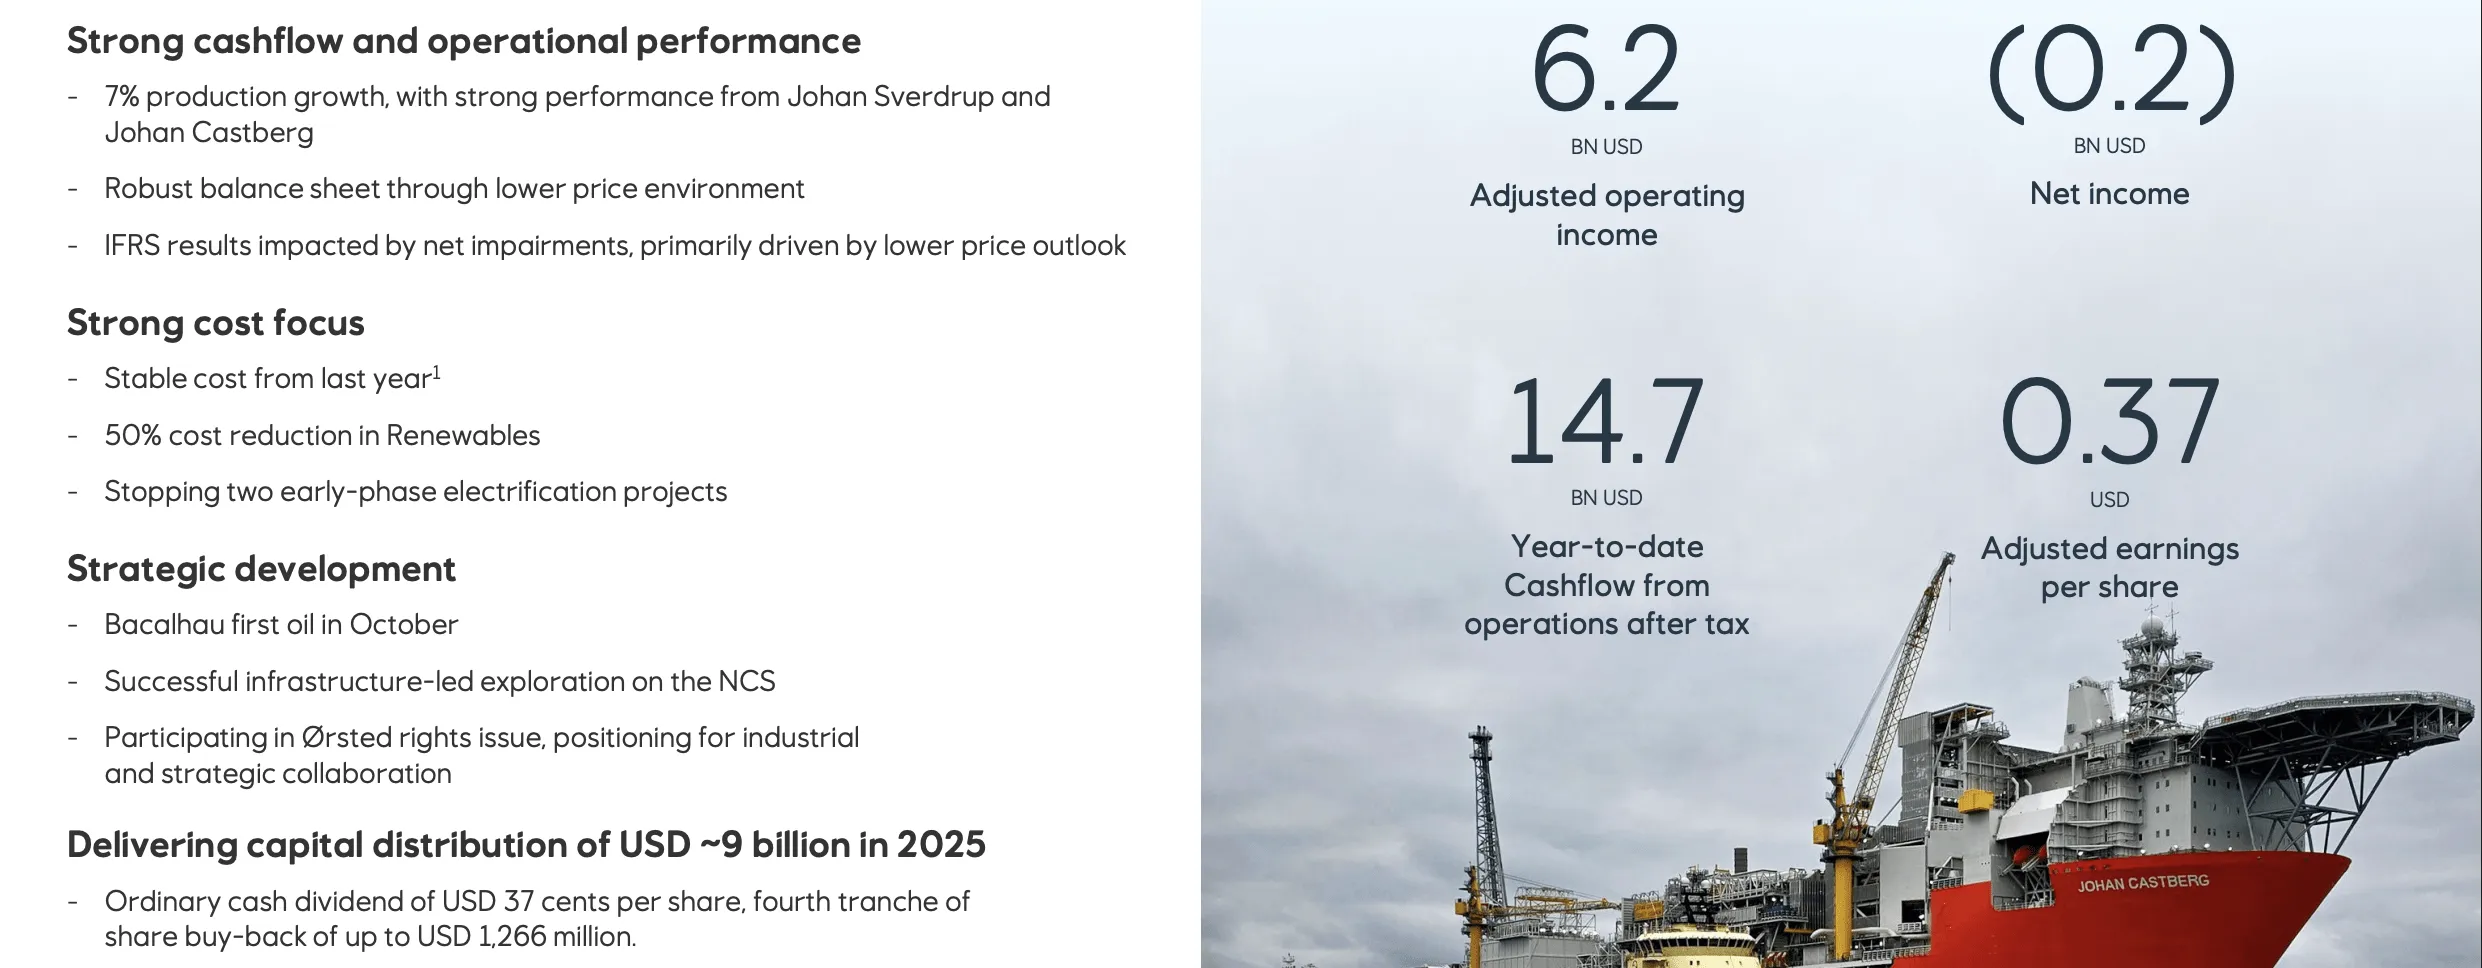
The capital return programme totals approximately $9 billion - a ~15% total shareholder yield at current market capitalisation. This is split between ordinary cash dividends of $0.37 per share per quarter (annualised ~$1.48, yielding approximately 6%) and a substantial share buyback programme of approximately $5.5 billion for the full year, including the Norwegian state's share. The dividend has a five-year growth rate of 10.35%, and at current earnings levels - forward EPS of $2.60 against a dividend per share of $1.81 - the payout ratio is comfortably sustainable.
The balance sheet is a fortress. Cash, cash equivalents and investments stand at $22.4 billion. The net debt to capital employed ratio decreased to 12.2% in Q3 - well below the company's guided range of 15–30%. This is a company that could weather a sustained commodity downturn without cutting its dividend, a claim that very few of its peers can credibly make.
There are some headwinds worth noting honestly. Net income for the first nine months declined 45% year-over-year, driven by lower oil and gas prices and net impairments of $754 million - primarily from lower long-term oil price assumptions applied to international assets. The company also recorded a $268 million one-off charge related to decommissioning of the US offshore Titan field. These are real costs, but they are non-recurring and do not impair the underlying cash-generating capacity of the business.
For income-focused investors, there is one important tax consideration: Norway applies a withholding tax on dividends paid to non-resident shareholders. Even after this double-taxation effect, the yield remains generous - but investors should verify the net yield applicable to their specific jurisdiction and any available tax treaty benefits.
Peer Positioning - Why Equinor Over Suncor or Cheniere
I often get asked: "Why not just buy Suncor for oil exposure, or Cheniere for gas?" It's a fair question, and answering it reveals exactly why I think Equinor is the better trade right now. The energy sector is not monolithic - different companies offer very different risk/reward profiles depending on their commodity exposure. So let me walk through the comparison honestly.
Gas Engine (vs. Cheniere LNG)
- Equinor: $2/MMBtu cost into $11/MMBtu European market - massive margin
- Cheniere squeezed: US gas costs up 17%, European/Asian LNG prices down 33%
- Equinor pipeline gas avoids LNG liquefaction/shipping costs entirely
- If European gas rallies, Equinor captures 100% of the upside; Cheniere's margin is compressed from both sides
Oil Engine (vs. Suncor SU)
- Suncor is a pure oil play - outperforms in oil rallies, underperforms in gas rallies
- Equinor offers oil exposure plus gas diversification - a hedge within a single position
- Johan Castberg achieves $5/bbl premium to Brent - quality crude advantage
- If oil rallies alongside gas, Equinor benefits from both - Suncor captures only one
| Metric | Equinor (EQNR) | Suncor (SU) | Cheniere (LNG) |
|---|---|---|---|
| Forward P/E | 8.8x | 13x | 11x |
| Dividend Yield | ~8% | ~4% | ~1% |
| Total Shareholder Yield | ~15% | ~8% | ~5% |
| Commodity Exposure | Oil + Gas + Renewables | Oil (primarily) | Gas / LNG (pure play) |
| Geopolitical Risk | Low (Norway, government-backed) | Low-Medium (Canada) | Low (US-based) |
| Production Growth YoY | +7% | Flat to +2% | N/A (throughput-based) |
Here is the bottom line, and I want to be honest about the trade-offs: Cheniere could outperform Equinor in a scenario where European gas prices rally but oil stays weak and US gas prices fall. Suncor could outperform if oil rallies but gas doesn't. Both of those are plausible outcomes. But Equinor is the position you take when you believe energy prices are broadly undervalued - because it captures upside from either or both commodity legs, pays you the highest dividend yield of the three while you wait, and trades at the cheapest valuation multiple. It is, in my view, the most intelligent diversified bet on a sector repricing that the market currently offers.
Scenario Analysis
What I like most about this trade is that it doesn't require both catalysts to fire. You can be wrong about oil, and the gas thesis still works. You can be wrong about gas, and the oil thesis still provides upside. Below, I map three scenarios across the commodity price spectrum - showing how Equinor's dual-engine structure protects capital when things go wrong and delivers exceptional leverage when they go right.
Bear Case
Base Case
Bull Case
Bear case: Oil prices decline further to $55/bbl on global recession fears or a trade war escalation. European gas prices remain flat. Equinor's earnings compress, but the balance sheet absorbs the shock - $22.4 billion in cash provides years of runway. The dividend is reduced but not eliminated. At Brent prices above $60/barrel, the company remains super profitable. Downside to approximately $20 represents a ~18% decline from entry midpoint, limited by the stop-loss.
Base case: Oil stabilises in the $65–$75 range as OPEC+ supply additions slow and demand growth absorbs the surplus. European gas prices move modestly higher on winter tightness and potential Russian LNG sanctions. Equinor delivers on its 4% production growth guidance, sustains the $9 billion distribution programme, and the market gradually re-rates the stock toward its European gas premium. Target: $32–$36.
Bull case: Both catalysts fire. A cold European winter drives TTF gas prices up 30%+. The oil market tightens faster than expected as OPEC+ spare capacity proves illusory and US drilling continues to decline. Equinor captures the double windfall through its diversified revenue base. The ~15% shareholder yield attracts income-focused capital flows. Target: $38–$44.
Risk Assessment
Every thesis has vulnerabilities, and I have no interest in downplaying them. If you're going to put capital to work here, you deserve to know exactly what could go wrong, how likely it is, and what the damage looks like. Here is my honest assessment of each major risk.
Sustained Oil Price Collapse Below $55/bbl
If a major global recession - triggered by the end of the AI investment cycle or a full-scale trade war - pushes Brent crude below $55 for an extended period, Equinor's earnings would contract materially. The dividend would likely be cut, and the share price could test $18–$20. However, the company remains profitable above $60/bbl, and the $22.4 billion cash position provides significant buffer. Our stop-loss at ~$21 limits exposure.
European Gas Market Normalisation via Russia Rapprochement
If peace unexpectedly breaks out and the EU resumes sizable Russian natural gas imports, the structural tightness that underpins the gas thesis would evaporate. We assess this as low-probability in the 9–12 month time horizon - the political dynamics in both Europe and Russia make a rapid rapprochement unlikely. But it is not impossible, and it would remove Equinor's most powerful near-term catalyst.
Norwegian Tax Regime Change
Norway already imposes one of the highest corporate tax regimes on oil and gas production in the world. Any further increase - while politically unlikely given the government's own majority ownership of Equinor - would reduce after-tax cash flows. The current regime is well-understood and already priced in; the risk is incremental change, not a regime shift.
Offshore Wind Capital Commitments (Orsted Exposure)
Equinor's participation in Orsted's rights issue and its pursuit of a board seat raise questions about potential future capital commitments to a struggling offshore wind sector. CFO Reitan has stated explicitly that the threshold for significant new capital in offshore wind is high. But the risk of mission creep - particularly if Orsted's situation deteriorates - is real. We take comfort in Reitan's clarity: remaining equity needs for Equinor's own projects (Dogger Bank, Empire Wind, Baltic) are limited and largely covered by investment tax credits.
Dividend Withholding Tax Friction
Norway's withholding tax on dividends for non-resident shareholders reduces the effective yield. This is a known cost, not a risk, but it does reduce the attractiveness of the ~8% headline yield by 15–25% depending on jurisdiction and available treaty benefits. Investors should model the net yield for their specific situation.
Geopolitical Disruption to NCS Operations
Norway is among the most stable jurisdictions in the world. The risk of operational disruption from geopolitical events is exceptionally low. The Sverdrup and Castberg fields are modern, well-maintained, and operate under stringent safety standards. The most realistic operational risk is weather-related maintenance delays, which are seasonal and predictable.
Technical Picture
Equinor's stock spent much of 2024 and 2025 trending sideways to lower, weighed down by declining oil prices and the market's persistent underweighting of the European gas thesis. The stock has been building a base in the $22–$27 range - a multi-month accumulation zone that is consistent with institutional buying at levels the market has historically treated as support. The $23.50–$25.50 entry zone sits within this base, offering a high-probability accumulation area.
Volume patterns suggest that selling pressure has been gradually exhausting itself. The stock is trading below its longer-term moving averages - consistent with the extended period of underperformance - but the rate of decline has flattened, which is typically the first technical signal of a trend change. RSI has recovered from oversold levels and is settling in a neutral-to-constructive range. A sustained move above $27 would confirm a technical breakout and likely accelerate the re-rating toward our target zone.
Live Price Chart (NYSE: EQNR)
The Trade
The following scenarios reflect the author’s personal analysis and are not investment recommendations. See our full disclaimer.
Core Thesis: Scenario Range for EQNR in the $23.50–$25.50 Zone
Equinor ASA at current prices offers one of the most compelling risk/reward setups in the global energy sector. You are buying Europe's most important gas supplier at the cheapest valuation multiple among its peers, collecting an ~8% dividend yield while you wait, and positioning for a double catalyst - European gas tightening and a potential oil repricing - that the market has not priced in. Production is growing at 7%, the balance sheet holds $22.4 billion in cash, and the Norwegian government's majority ownership ensures capital discipline that activist-influenced peers cannot match.
Catalyst Timeline: Q1 2026 – Q4 2026
Execution Guide
- Scenario Entry Range: $23.50–$25.50. Build in tranches. Tranche 1 (50%) at $24–$25.50 immediately. Tranche 2 (30%) on any pullback toward $23–$24. Tranche 3 (20%) in reserve for a potential flush toward $21–$22 on broad energy sector sell-off.
- Risk Consideration: Moderate risk due to commodity price sensitivity. 3–5% of a diversified portfolio is appropriate. Income-focused investors may size toward the higher end given the ~8% dividend yield and ~15% total shareholder yield, which meaningfully compensates for holding time.
- Dividend Collection: Equinor pays quarterly dividends of $0.37/share (~$1.48 annualised). Collecting dividends while waiting for the catalyst reduces effective cost basis. Non-resident investors: verify the net yield after Norwegian withholding tax and any applicable tax treaty benefits for your jurisdiction.
- Upside Scenario Milestones: First exit (30%) at $28–$30 - initial resistance zone and first confirmation of re-rating. Second exit (40%) at $32–$34 - mid-target zone, base case realisation. Final exit (30%) at $35–$36 - upper target, full double-catalyst scenario.
- Thesis Invalidation Level: $21.00. A sustained close below this level indicates either a structural oil collapse below $55/bbl or a fundamental shift in European gas dynamics (Russia rapprochement). Below this level the thesis no longer holds. Downside from entry midpoint to stop is approximately ~14%. Note that the $21.00 stop-loss sits within the bear case range of $20-$23 - this is intentional. Waiting for full bear case resolution at $20 would require absorbing excessive loss. The stop at $21 represents the maximum drawdown we are willing to accept before exiting and reassessing, regardless of where the bear case ultimately settles. Position sizing is set accordingly.
- Key Monitoring Points: European TTF gas spot price and storage levels (weekly); Brent crude and OPEC+ production compliance data (monthly); Equinor's quarterly production and earnings updates; US drilling rig count (Baker Hughes, weekly); any developments on Russian LNG sanctions; Bacalhau production ramp-up progress.
Important Disclaimer
This content is for informational and educational purposes only and does not constitute financial advice, investment recommendations, or solicitation to buy or sell any securities. Past performance does not guarantee future results. All investments carry risk, including the possible loss of principal. Equinor ASA (NYSE: EQNR) is subject to commodity price risk (oil and natural gas), geopolitical risk, currency risk (NOK/USD), Norwegian tax regime risk, operational risk related to offshore production, and general market risk. Natural gas prices in Europe are highly volatile and may not follow the seasonal or structural patterns described herein. Oil prices are influenced by OPEC+ decisions, global demand dynamics, and geopolitical events that are inherently unpredictable. Norwegian withholding tax on dividends for non-resident shareholders may reduce effective dividend yields; investors should consult a tax advisor regarding their specific situation. The scenario analysis and financial estimates are based on publicly available information and independent analytical models as of January 2026; actual results may differ materially. Always conduct your own due diligence and consult a qualified financial advisor before making any investment decision.