Here is the situation in plain terms: Exxon Mobil - one of the most profitable energy companies on earth, a dividend champion that has raised its payout for over four decades, and a business generating tens of billions in operating cash flow - is sitting at a valuation multiple at the low end of its own historical range, at a moment when most investors have written it off because oil prices dipped.
Oil weakness is real. The headlines about OPEC production increases and softening demand are real. But what the market seems to be mispricing is the rest of the story: a massive natural gas business that is about to be turbocharged by a colder-than-expected winter, a transformational Guyana production ramp that adds long-duration low-cost barrels to the mix every year, a freshly permitted Golden Pass LNG terminal, and a balance sheet so solid that the company spent $9.8 billion buying back its own stock in just the first half of 2025.
The question isn't whether Exxon is a great company. It demonstrably is. The question is whether the current pessimism is creating a window - and we believe it is.
Snapshot - October 21, 2025
Key Figures at a Glance
Exxon Mobil needs little introduction. It is one of the largest publicly traded energy companies in the world, operating across the full spectrum of upstream (exploration & production), downstream (refining), and chemicals. What it does need is a re-examination right now, because the market's laser focus on oil price weakness is causing investors to overlook a more nuanced and frankly compelling picture.
The stock has been under pressure since oil prices slid from their 2022 peaks and have now settled in the low-$60s per barrel. That pressure is rational - lower oil prices do compress Exxon's upstream earnings. But Exxon is not a pure-play crude oil business. It is a diversified energy conglomerate with natural gas operations, a massive refining segment, a chemicals business, and a rapidly growing portfolio of new energy materials.
At the current entry zone of $110–$115, the stock's P/Cash flow multiple sits at the low end of its historical range - the kind of level that, historically, has rewarded patient investors who were willing to look past near-term commodity noise.
Oil prices hovering around $62 - creating investor pessimism that may be overdone.
Oil Down, Gas Up: The Dual-Force Dynamic
The narrative dominating Exxon right now is simple: OPEC is adding supply, trade tensions are weighing on demand, and oil prices could stay soft. That's the bear case, and it has some merit. What it ignores, however, is that Exxon is also one of the US market's most significant producers of natural gas - and the natural gas story heading into winter 2025 is a very different one.
"A large portion of the US is expected to face a colder-than-average winter in 2025 and 2026, with the Northern Plains, Great Lakes, and New England likely seeing the most intense cold - particularly in mid-January and mid-February."
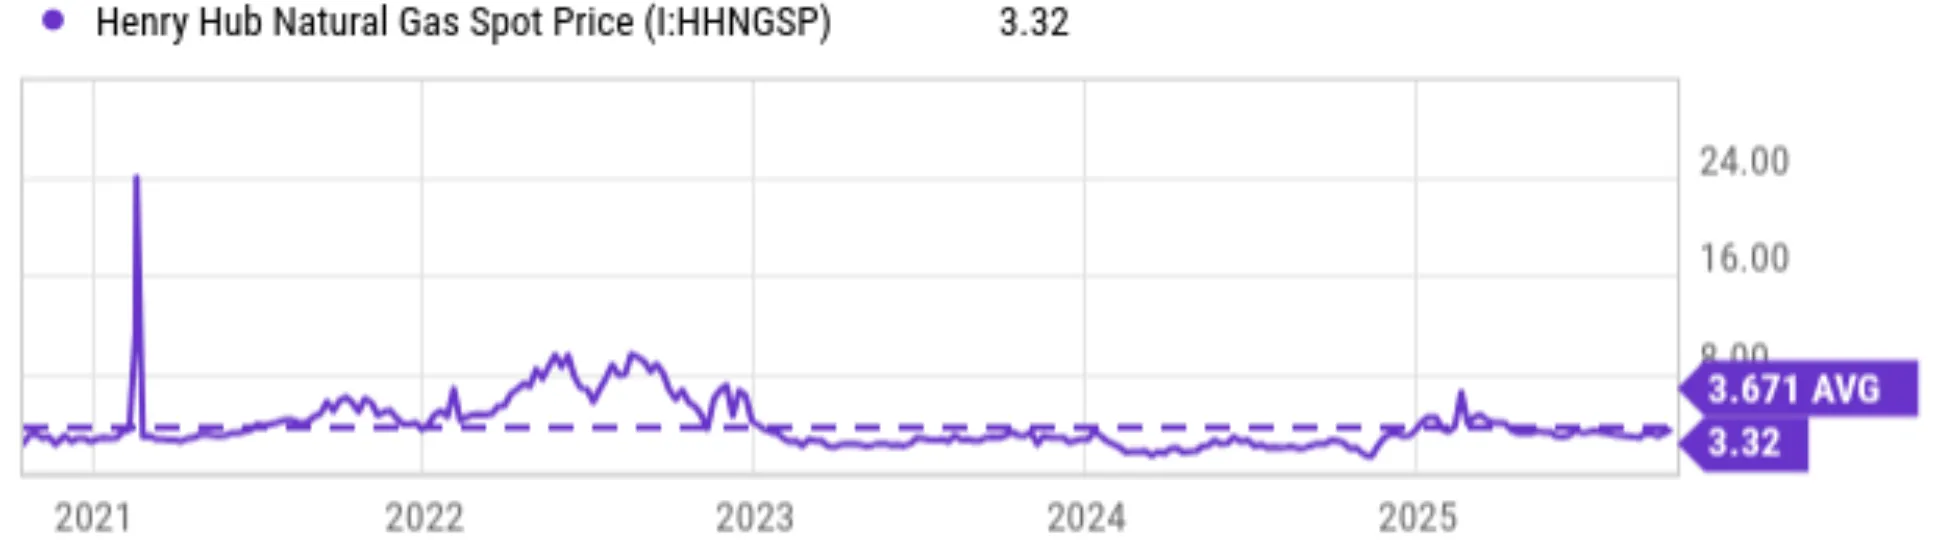
- Seasonal weather forecast consensus, Q4 2025Natural gas is currently priced around $3.32 per MBTU, roughly 10% below its five-year historical average of $3.67. But here's what matters: the current storage situation is much tighter than the headline number suggests. Working gas inventory across the lower 48 states stood at approximately 3,618 billion cubic feet as of early October 2025. That's only about 22 Bcf more than the same period last year - a buffer that sounds meaningful until you consider that residential NG consumption alone averages 12–13 Bcf per day, and in a cold month, that figure can more than double.
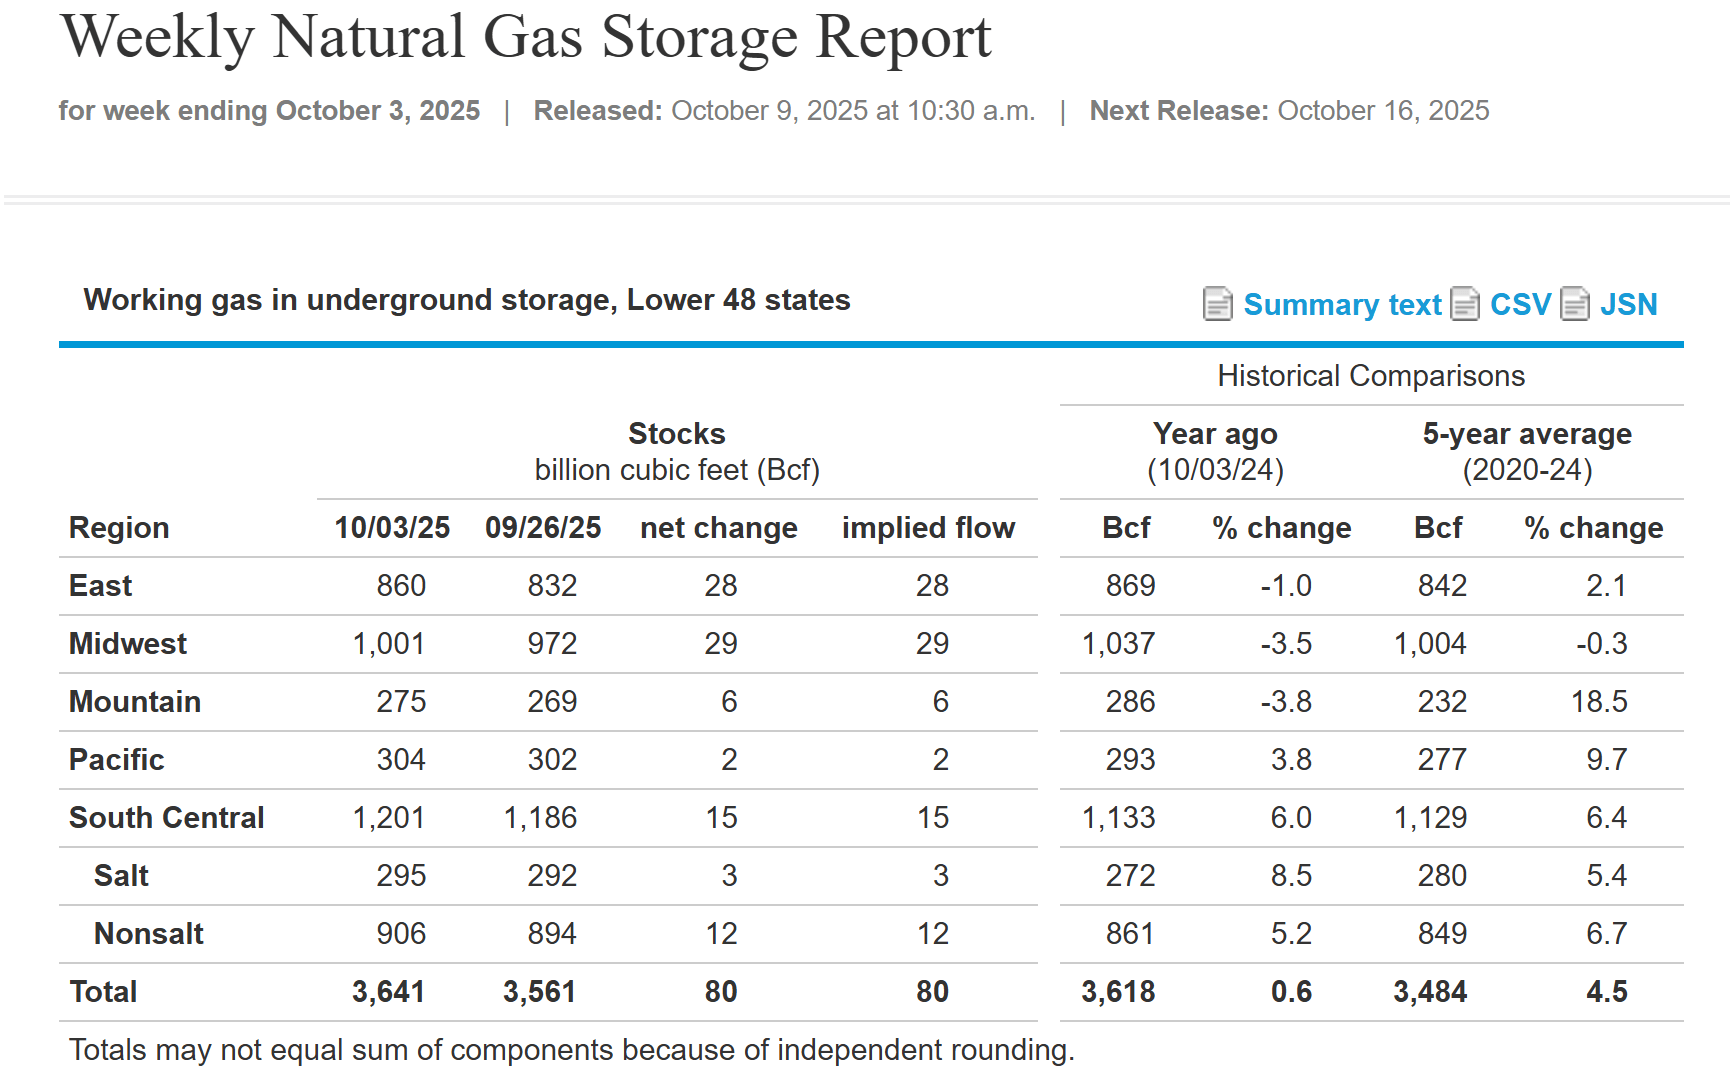
In other words, the margin of safety in storage is thin. A colder winter doesn't need to be dramatic to shift the demand-supply dynamics meaningfully. And when it does, natural gas prices respond quickly - which directly feeds into Exxon's earnings.
Here is the sensitivity that makes this concretely interesting: Exxon produces approximately 8.7 billion cubic feet of natural gas per day on average. Using a breakeven price of around $2.80/MBTU from its Permian operations, every $0.10 per MBTU increase in natural gas prices translates to roughly $0.08 in additional EPS for XOM. That's a lever that doesn't get discussed much - but in a year where gas could move from $3.32 toward $4.50–$5.00 on a cold-winter demand surge, that's a potential EPS boost of more than $0.90 to $1.10 per share. This re-rating toward $130–$135 assumes not just the EPS uplift but also a modest P/E expansion from approximately 13x to 14–15x as the market re-prices Exxon's improved earnings mix toward higher-margin natural gas - a reasonable expectation when commodity tailwinds drive outsized FCF generation. The broader target of $140–$160 is supported by the full suite of catalysts described below.
The Natural Gas Math in a Cold Winter Scenario
Exxon NG production capacity: ~8.7 Bcf/day | Breakeven: ~$2.80/MBTU
Sensitivity: +$0.10/MBTU NG price → +$0.08 EPS for XOM
If NG rises from $3.32 to $4.50–$5.00 (plausible cold-winter scenario):
EPS uplift: +$0.96 to +$1.12/share → stock re-rating toward $130–$135 on this catalyst alone (incorporating both the EPS uplift and a modest P/E expansion from approximately 13x to 14–15x as the market re-prices Exxon's earnings mix).
Meanwhile, the oil price headwind is real but not necessarily terminal. The market is pricing in a prolonged soft-oil environment, which is one legitimate scenario. But it is not the only scenario. A re-escalation of Middle East tensions, a reversal of OPEC production decisions, or simply a colder-than- expected winter boosting fuel oil demand could all shift the oil picture faster than consensus expects. Exxon doesn't need a dramatic oil recovery to hit our target - it just needs natural gas to do its thing and the market to stop pricing the stock as if earnings will permanently be near their current trough.
Beyond Crude: The Growth Transformation
One of the more underappreciated aspects of Exxon's story right now is just how much the company is changing beneath the surface. While oil price headlines dominate, management has been methodically building a set of long-duration assets and new business lines that will define the company's earnings power into the 2030s - at margins that are, in several cases, significantly above today's corporate average.
Guyana: Adding World-Class Barrels Every Year
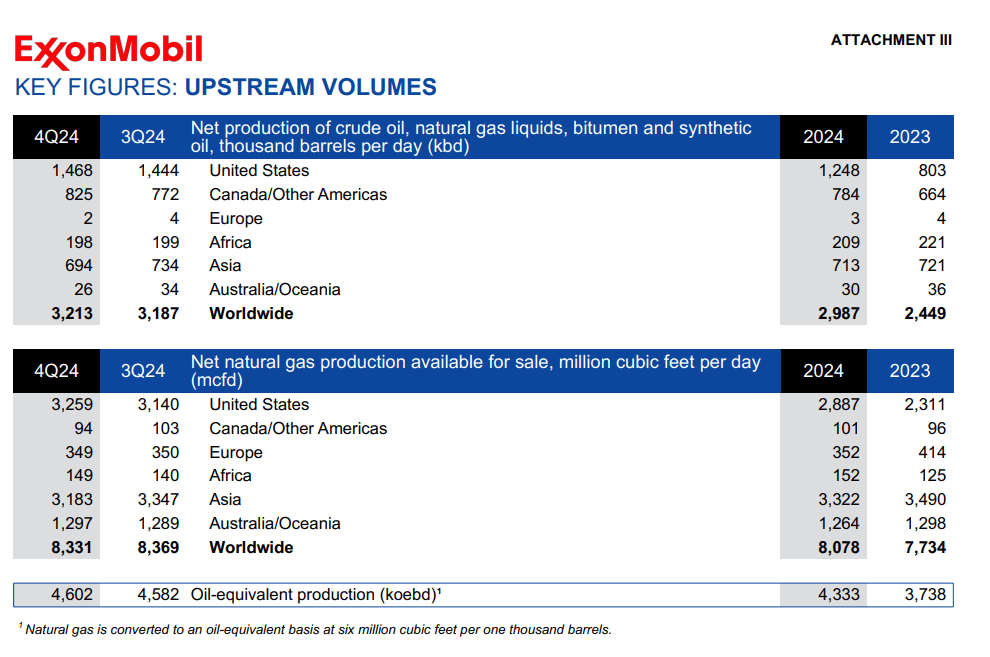
The Stabroek block offshore Guyana is one of the best oil discoveries of the past 20 years, full stop. By mid-2025, Exxon had 650,000 barrels of oil equivalent per day producing across three major developments, with a fourth - Yellowtail - coming online in August 2025 and adding another 250,000 boe/d. That brings the total regional production to approximately 900,000 boe/d. By 2030, management is targeting 1.7 million barrels of oil equivalent per day across eight developments. These are long-duration, low-breakeven barrels being added to the portfolio - the kind of assets that improve margin quality regardless of where the oil price cycle happens to be.
Exxon's ongoing efficiency drive and advantaged new assets are compounding profitability over time - even at weaker commodity prices.
Permian: The Cost-Curve Leader
At the same time, Exxon's Permian Basin operation is not standing still. Production reached 1.6 million barrels of oil equivalent per day as of Q2 2025, with management targeting 2.3 million boe/d by 2030. The company has deployed enhanced oil recovery techniques using petroleum coke from its own refineries - achieving a 20% improvement in oil and gas recovery per well. That kind of operational innovation is what allows Exxon to grow volume and improve margins simultaneously, rather than treating them as a trade-off.
Golden Pass LNG: A New Revenue Stream at Just the Right Moment
In late September 2025, Exxon received US Department of Energy approval to re-export LNG from the Golden Pass terminal in Texas, with first gas expected by end of 2025 or early 2026. At full capacity, the terminal will handle 18 million tonnes per annum (MTPA). Exxon markets 30% of that volume, with QatarEnergy Trading handling the rest. This is a meaningful incremental revenue stream hitting at exactly the moment when the EU–US trade deal (which includes $750 billion in US energy purchases through 2028) and the Japan deal (which carves out specific LNG offtake agreements) create structural demand for US LNG exports. Exxon is not a passive observer of that demand - it is a direct beneficiary.
New Energy Materials: The Long Game
In September 2025, Exxon announced its intent to acquire Superior Graphite's US assets - a producer of synthetic graphite for electric vehicle batteries. The strategy is elegant: rather than mining graphite the traditional way, Exxon plans to produce it from the carbon-rich feedstock already flowing through its refineries. Lower energy intensity, better land use, and lower carbon intensity versus traditional mining. Together with the Proxxima thermoset systems product line (a high-performance material targeting the automotive, infrastructure, and subsea sectors), Exxon's new energy and materials segment is expected to contribute $3 billion in additional earnings by 2026, scaling toward $20 billion by 2030.
Guyana and Permian are the twin engines driving Exxon's production growth through the decade.
What this means for investors is that Exxon is not simply a leveraged bet on oil prices. It is a company that is systematically improving its earnings quality - moving up-cycle assets into lower-breakeven production, adding LNG export capacity at a geopolitically ideal moment, and building adjacent businesses in materials and low-carbon solutions that carry better margins than legacy refining.
Management has been explicit about the efficiency drive: once a target is met, a new one is set. The corporate culture at Exxon is one that does not tolerate operational stagnation. Workforce rationalisation, including a 2,000-person global reduction announced in 2025, is part of a continuous productivity push that began years ago and is not a sign of distress - it is the opposite.
The Financial Fortress
There is a kind of company that you want to own during uncertain times - one where the balance sheet itself is a source of competitive advantage, not merely an absence of worry. Exxon Mobil is that company. Let's be specific about what that means in practice.
A net debt/EBITDA ratio of 0.33× is not just "conservative" - it means Exxon could theoretically repay its entire outstanding debt in about four months of EBITDA generation. That is a level of financial resilience that allows the company to continue investing through downturns, maintain and grow its dividend, and repurchase shares at scale - all simultaneously. The $9.8 billion in share buybacks completed in just the first six months of 2025 is not a one-off; it reflects a structural capital return commitment that management has demonstrated year after year.
Operating cash flow remains robust enough to cover capital expenditure and sustain increasing dividend payouts even with oil in the low $60s. The debt maturity profile is long and well-laddered. Operating leverage has actually been improving: the operating cost ratio fell to 78.4% in Q2 2025 from 80.9% a year earlier - meaning the company is becoming more efficient at the same time that revenues are under commodity price pressure. That combination is exactly what you want to see in a cyclical downturn: a business that is getting leaner when the going gets tough, so that when the cycle turns, the earnings power leverage is higher than it was in the previous cycle.
And then there is the dividend. Exxon's current yield of approximately 3.5% sits above its three-year historical average of 3.39% - a signal that the stock is priced at a discount on an income basis relative to its own norm. The dividend yield spread versus the XLE energy ETF is also running above its three-year average, confirming relative cheapness within the sector, not just on an absolute basis. Exxon's dividend champion status - more than four decades of consecutive annual increases - is not window dressing. It reflects the underlying financial discipline and cash generation capability of the business across multiple commodity cycles.
What the Valuation Says
Valuation for a company like Exxon is never a single number - it is a range of perspectives, each illuminating a different aspect of value. Let's walk through the approaches that matter most.
P/Cash Flow: Historically Discounted
At the entry zone of $110–$115, Exxon's price-to-operating-cash-flow multiple sits at approximately 8.7×–8.8× on a trailing twelve-month basis. This is toward the lower end of its historical range - the kind of level that has historically been associated with strong forward returns for patient long-term holders. The market is effectively pricing in a perpetually weak commodity environment; if even one element of the thesis (natural gas, LNG exports, oil recovery) improves meaningfully, the multiple expands alongside earnings, creating a double-positive effect on the stock price.
DCF Model: 20%+ Upside Even in the Conservative Case
A Discounted Cash Flow analysis of Exxon's earnings power - incorporating current oil at low-$60s, moderate natural gas, and the Guyana/Permian growth profile - arrives at a base-case price target in the range of $140.88. Even applying an additional 10% risk haircut to account for near-term oil price weakness and macro uncertainty, the risk-adjusted target remains above $126 - comfortably above the current entry zone. The DCF therefore confirms that the margin of safety here is real, not manufactured.
Dividend Discount Model: Income Perspective
Exxon's annualised dividend stands at $3.96 per share, growing at a four-year CAGR of approximately 4.2%. Applying a conservative cost of equity (using a beta above the reported 0.55x and a risk premium of 5.5%), the Dividend Discount Model arrives at a fair value between $120 and $126 - again comfortably above the entry zone and confirming that even the most conservative income-based approach supports a buy thesis.
Multiple analyst notes from Q4 2025 converge on a similar reading of the technical setup: with the RSI sitting at 54, the price near $112, and over 20% upside in the base case, there remains wide room for buying. Technicals agree with fundamentals - buying opportunities and bullish signals remain evident amid some dips. This is not a stretched tape; it is a base-building pattern consistent with the early stages of a new up leg rather than exhaustion.
Analyst Consensus: $147 Price Target
The sell-side consensus price target for XOM as of October 2025 sits at approximately $147 per share, based on 7.83× forward EBITDA on FY2027 estimates - a year that incorporates additional Guyana developments coming online, Golden Pass LNG ramping up, and the new energy materials segment contributing incrementally. Our target range of $140–$160 is consistent with this analyst consensus while also reflecting the upper-end scenario in which natural gas performs well in winter 2025 and oil prices find a floor above $65.
Bull Case vs. Bear Case
Let's be honest about both sides of this trade. There is a genuine bear case, and it deserves acknowledgment. There is also a compelling bull case that, in our view, substantially outweighs it.
The Bull Case
- Valuation at the low end of historical range - P/Cash at 8.7× vs. normalised 10–11× represents meaningful upside simply from re-rating
- Natural gas wildcard - cold winter forecast with tight storage creates a realistic scenario where NG prices rally sharply, adding $0.90–$1.10 to EPS and pushing the stock toward $130–$135 on this catalyst alone
- Guyana ramp is unstoppable - approximately 900,000 boe/d today, targeting 1.7 million boe/d by 2030, with low-breakeven long-duration barrels systematically improving upstream margin quality
- Golden Pass LNG approval creates a new durable revenue stream at exactly the right moment - EU and Japan trade deals provide structural LNG demand
- New energy materials ($3B additional earnings in 2026, $20B by 2030) are not priced in at all at current levels
- Dividend yield of 3.5% above historical average - income-based floor under the stock
- $9.8B in buybacks in H1 2025 - share count declining, EPS growing mechanically even without an oil recovery
- Balance sheet (0.33× net debt/EBITDA) provides ability to invest through the cycle and pursue acquisitions of distressed assets
The Bear Case
- Oil prices could stay depressed at sub-$65 for longer than expected - if OPEC follows through on production increases and trade tensions drag global demand, upstream earnings could disappoint for multiple quarters
- OPEC production decisions can influence both oil and natural gas prices - a supply increase scenario removes the NG price catalyst if associated gas floods the market
- Russian/Ukraine conflict resolution could be negative for natural gas prices - a ceasefire that restores Russian gas flows to global markets could suppress European LNG demand
- EV adoption, while slower than feared, still represents a long-run structural headwind to demand for petroleum products
- Revenue already under pressure - Q2 2025 operating revenue was $81.6B, down 12.3% year-over-year from $93.1B, reflecting lower oil price realizations
- New energy materials business carries execution risk - synthetic graphite production at scale is unproven and the Proxxima ramp is in early stages
The balance of this, in our assessment, clearly favours the bulls. The bear case requires multiple simultaneous negative outcomes - sustained oil weakness, no NG winter rally, OPEC discipline holding, and new businesses underperforming. The bull case requires only one or two of the positive catalysts to materialise - and the balance sheet provides the resilience to weather the downside scenarios while waiting for the upside to emerge.
Risk Landscape
Moderate Risk - Large-Cap Integrated Energy
Exxon Mobil is a large-cap, investment-grade company with a multi-decade track record of generating cash across commodity cycles. This is not a speculative position. However, all energy investments carry meaningful commodity price risk, and the below factors should be understood and weighted before sizing a position.
- Oil Price Risk: The most direct and immediate risk. At sub-$60 Brent, Exxon's upstream earnings deteriorate significantly and the stock will come under pressure regardless of how compelling the longer-term thesis is. Our thesis does not require an oil rally - but a sustained move below $55 would challenge the near-term target timeline.
- OPEC Production Risk: If OPEC accelerates its previously curtailed production more aggressively than expected, the combination of lower oil prices and additional associated gas supply could simultaneously suppress both of the key revenue drivers. This is the most consequential single external risk to the thesis.
- Natural Gas Disappointment: If winter 2025–2026 turns out warmer than forecast, the NG catalyst does not materialise. The weather forecasts are probabilistic - not guaranteed. A mild winter eliminates the near-term EPS uplift from the NG segment, pushing the thesis into a longer holding period waiting for Guyana and LNG to drive the story.
- Macro and Geopolitical Wild Cards: A resolution of the Russia-Ukraine conflict could restore Russian gas flows to global markets and compress European LNG demand precisely when Golden Pass is ramping up. Conversely, an escalation could spike oil prices and accelerate the bull case. Geopolitical outcomes are inherently unpredictable.
- Execution Risk on New Businesses: Synthetic graphite production via the Superior Graphite acquisition and the Proxxima scale-up are genuine growth stories, but they are early-stage. Delays, cost overruns, or slower-than-expected market adoption would push out the earnings contribution timeline without materially damaging the core thesis.
- Thesis Invalidation Guidance: A sustained daily close below $100 - approximately 10–12% below the entry midpoint - would signal a fundamental deterioration beyond our assumptions (either oil meaningfully below $55 or a significant unexpected event) and warrants reassessment of position size.
Technical Picture
Fundamentals set the direction; technicals set the timing. And here, both are aligned. The technical picture for XOM as of October 2025 is one of a stock that has absorbed significant selling pressure, found a base, and is beginning to build constructive price action consistent with the start of a new up leg - not the capitulation of one.
Technical Analysis Chart - XOM, October 2025
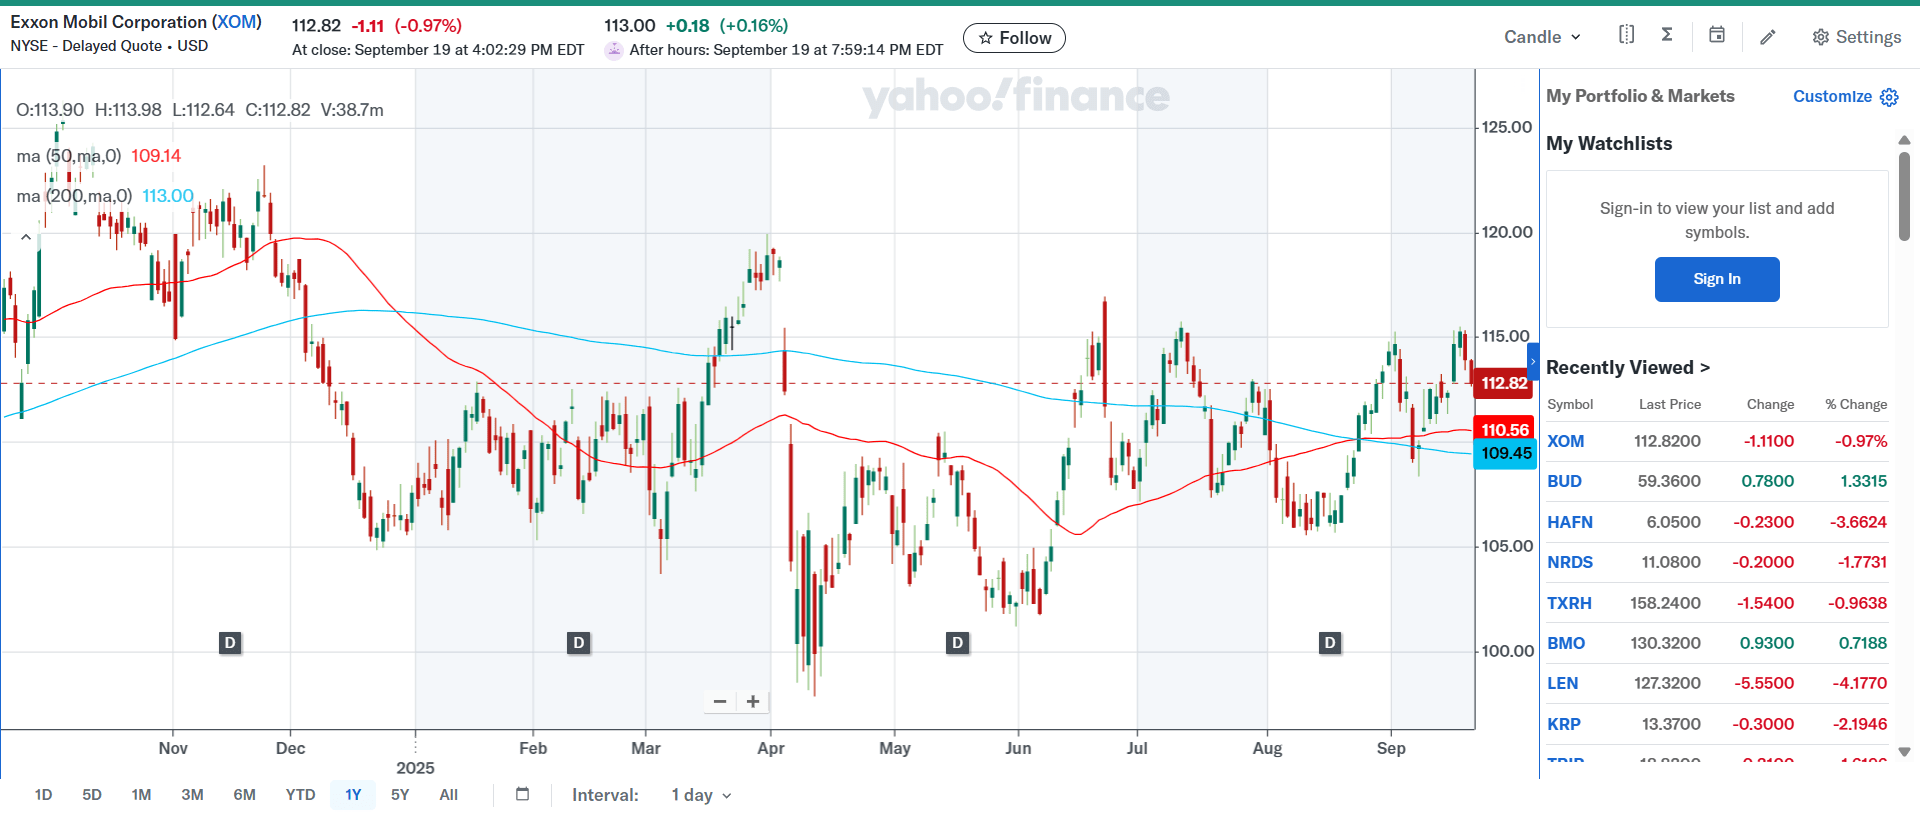
XOM technical picture: bullish structure intact with RSI at 54, price above 50-day SMA, and MACD holding in positive territory. Source: TradingView / Yahoo Finance.
Reading the Chart
The stock made a series of higher highs and higher lows through 2023 and into 2025 - an uptrend that remained structurally intact even as oil prices softened. The 50-day simple moving average continues to slope upward and sits between the price and the 200-day SMA, a classically constructive arrangement that indicates recent market sentiment remains net positive.
The RSI tells an interesting story: after hitting overbought territory earlier in the year (a surge that brought buyers in, then prompted profit-taking), the RSI pulled back to around 46 at a price level near $109. At that point, buyers returned - recognising the pullback as an entry opportunity rather than a trend reversal. By early October, RSI had recovered to approximately 54, with the stock stabilising around $112. That reading - mid-range, recovering from an oversold dip - is consistent with a stock that has found its footing and has room to move higher before becoming extended.
The MACD confirms the picture: the MACD line and histogram remain in positive territory overall, signalling that buying volume continues to outpace selling volume on a net basis. There was a brief moment where the MACD line threatened to cross below the signal line - the period when selling volume briefly picked up as some investors took profits after the overbought reading. But that moment has passed, and the current configuration suggests the pullback is over and the trend is reasserting itself.
Live Price Chart (NYSE: XOM)
The Trade
The following scenarios reflect the author’s personal analysis and are not investment recommendations. See our full disclaimer.
Core Thesis: Scenario Range for XOM in the $110–$115 Zone
The investment thesis for Exxon Mobil at current levels is straightforward: a world-class, financially bulletproof energy company is trading at a historically depressed valuation, at a moment when the market's pessimism about oil is causing it to overlook a set of genuine, near-term catalysts - natural gas, LNG exports, Guyana production growth, and new energy materials. The downside is cushioned by a 3.5% dividend yield and a balance sheet that can weather years of soft commodity prices. The upside is supported by three independent valuation frameworks that all point toward the $140–$160 range in 6–12 months. Risk/reward of approximately 1:3.
Detailed Action Plan
- Scenario Entry Range: $110–$115. The current dip into this range represents the best entry opportunity in the near term, coinciding with technically constructive base-building and historically low valuation multiples. Consider building the position in tranches: Tranche 1 (50% of position) at $110–$113 immediately; Tranche 2 (30%) at any pullback toward $107–$110; Tranche 3 (20%) held in reserve for a potential flush toward $103–$105 on broad energy sector weakness.
- Position Sizing: Given the moderate risk profile of a large-cap blue chip, XOM can support a larger position size than a typical speculative tip - 3–7% of a diversified portfolio is reasonable. Income-focused investors may size even larger given the 3.5% dividend yield, which compensates investors for holding while the thesis develops.
- Catalysts to Watch (in order of priority): First, the winter 2025–2026 weather pattern - any sustained cold in the Northern Plains and Great Lakes should show up rapidly in natural gas spot prices and be a direct buy signal for adding to the position. Second, Exxon's Q3 and Q4 2025 earnings announcements - listen for natural gas volume and price realizations, Guyana production numbers, and any Golden Pass LNG update. Third, oil price action - sustained Brent above $70 would be a meaningful positive re-rating catalyst that adds to the thesis.
- Upside Scenario Milestones: First partial exit (25% of position) at $130–$135 - the natural gas cold-winter target range, where a meaningful re-rating event should attract additional momentum buyers. Second exit (25%) at $145–$150, approaching the analyst consensus target. Main exit (40%) at $155–$160, the upper bound of the target zone. Retain 10% as a long-term core holding - Exxon's Guyana and LNG assets will continue generating value well beyond the 6–12 month tip horizon, and the dividend alone justifies a small permanent position.
- Thesis Invalidation Level: A sustained daily close below $100 warrants a full reassessment. At that level, either oil has moved significantly below $55, or some unexpected company-specific negative has emerged. Exit and wait for the picture to clarify.
- Dividend Reinvestment: While holding this position, collecting the $3.96 annual dividend ($0.99 per quarter) reduces the effective cost basis over time. Investors who reinvest the dividend buy additional shares at whatever price prevails on the ex-dividend date - compounding returns if the stock moves toward target.
- Broker and Ticker: XOM trades on the NYSE. Accessible through all major US brokerages. International investors may access XOM directly through NYSE-listed shares or through local exchange equivalents where listed (e.g. XOM:CA on Canadian exchanges).
Catalyst Timeline: October 2025 – October 2026
-
Winter 2025 - Natural Gas Demand Spike
Cold weather across the Northern Plains and Great Lakes drives NG spot prices toward $4.50–$5.00. Every $0.10/MBTU gain in NG adds ~$0.08 EPS. This is the fastest-moving and most immediately actionable catalyst in the thesis.
-
Q4 2025 / Early 2026 - Golden Pass LNG First Gas
Golden Pass ships its first LNG cargoes. Management guided toward end of 2025 or early 2026 for first gas. A confirmed first cargo is a significant milestone that demonstrates the new revenue stream is operational, not just permitted.
-
Q1–Q2 2026 - Guyana Expansion Continues
Uaru and Whiptail projects continue construction toward their 2026 and 2027 online dates. Any Guyana-related production update above consensus expectations would be a positive catalyst. The Hammerhead approval (September 2025) adds another 150,000 boe/d into the mix by 2029.
-
2026 - New Energy Materials Earnings Contribution
Exxon's management has guided for $3 billion in additional earnings from low-carbon solutions by 2026. Any early indication that Proxxima or synthetic graphite is ramping ahead of schedule would be a meaningful positive surprise for a market that is not pricing in this segment at all.
-
Ongoing - Oil Price Recovery
Not a required catalyst, but a bonus if it materialises. Any sustained move in Brent above $70 would add meaningfully to upstream earnings and likely accelerate the stock's move toward the upper end of the target range.
Important Disclaimer
This content is for informational and educational purposes only and does not constitute financial advice, investment recommendations, or solicitation to buy or sell any securities. Past performance does not guarantee future results. All investments carry risk, including the possible loss of principal. Exxon Mobil Corporation (NYSE: XOM) is subject to commodity price risk, geopolitical risk, regulatory risk, and general market risk. The price targets, EPS sensitivity analyses, and valuation frameworks cited in this tip are based on publicly available information and independent analytical models as of October 2025; actual results may differ materially. Natural gas price forecasts and winter weather projections are probabilistic - cold weather scenarios are not guaranteed. Oil price assumptions reflect conditions as of the tip date and are inherently unpredictable. Dividend continuity, while historically supported by Exxon's financial strength, is not guaranteed. Always conduct your own due diligence and consult a qualified financial advisor before making any investment decision. The authors and publishers are not responsible for any financial losses resulting from the use of this information.