Five years ago, Robinhood was the company that temporarily halted trading in GameStop and watched its stock crater from $85 to $7.70 over the following eighteen months. The narrative calcified: Robinhood was a gamified toy for reckless speculators, one bad crypto winter away from irrelevance. That story was never entirely wrong - but it became entirely outdated sometime around mid-2024, and the market has been slow to notice.
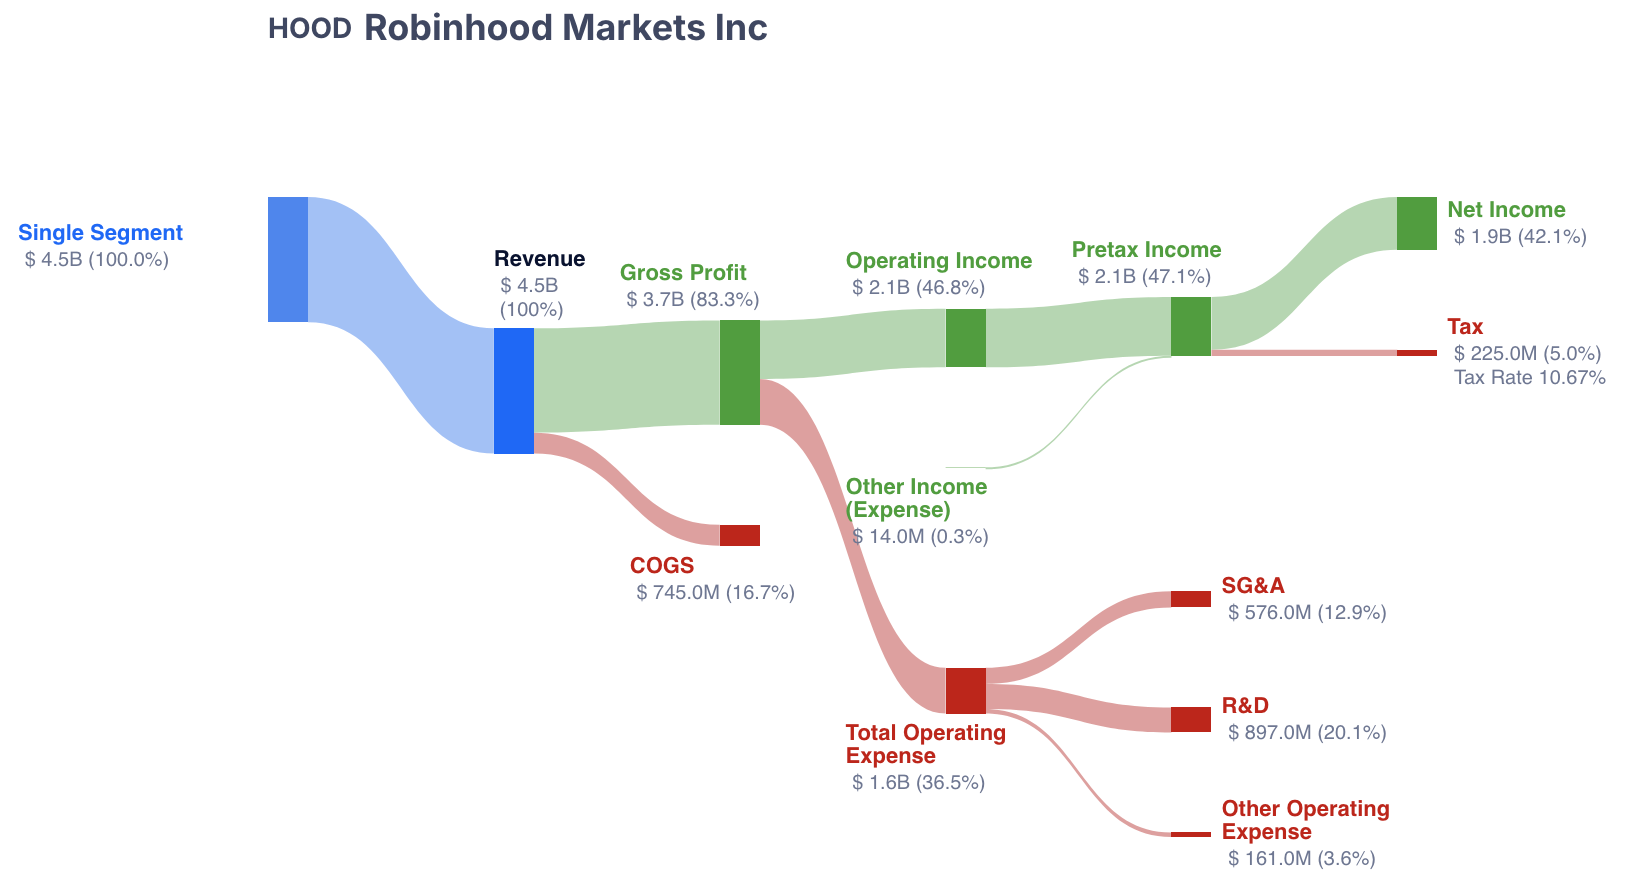
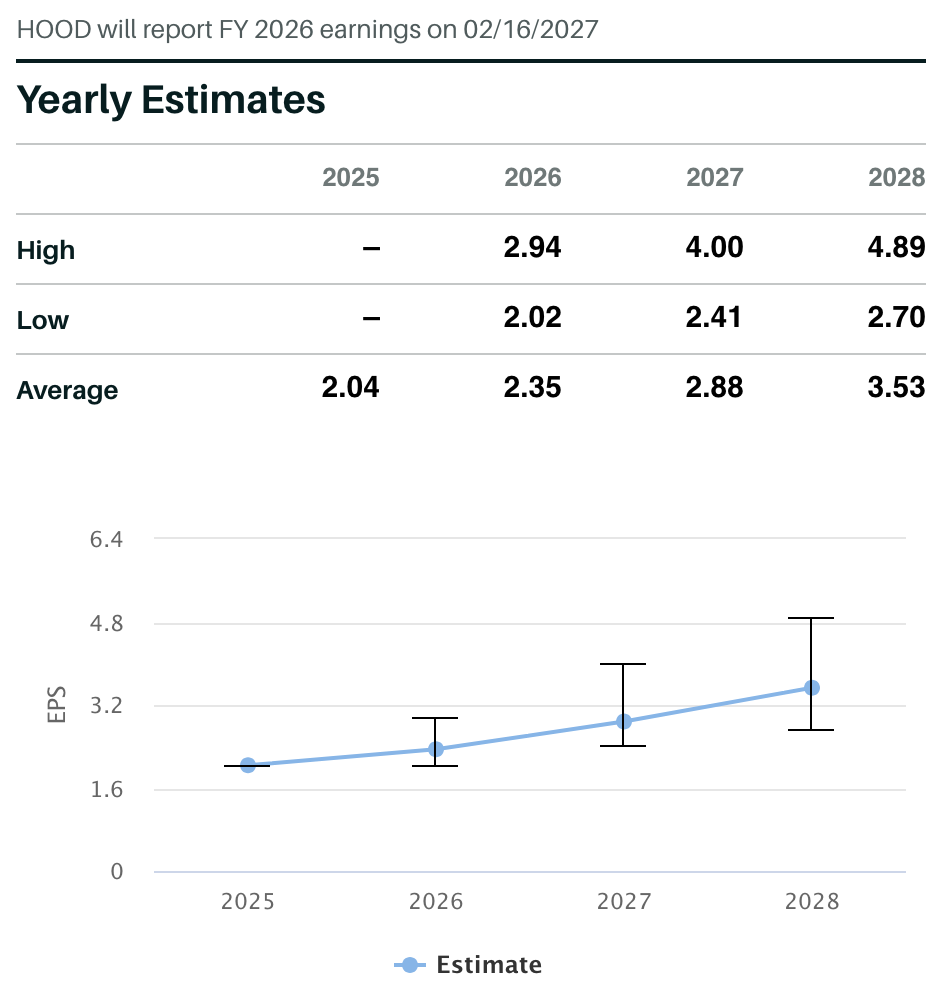
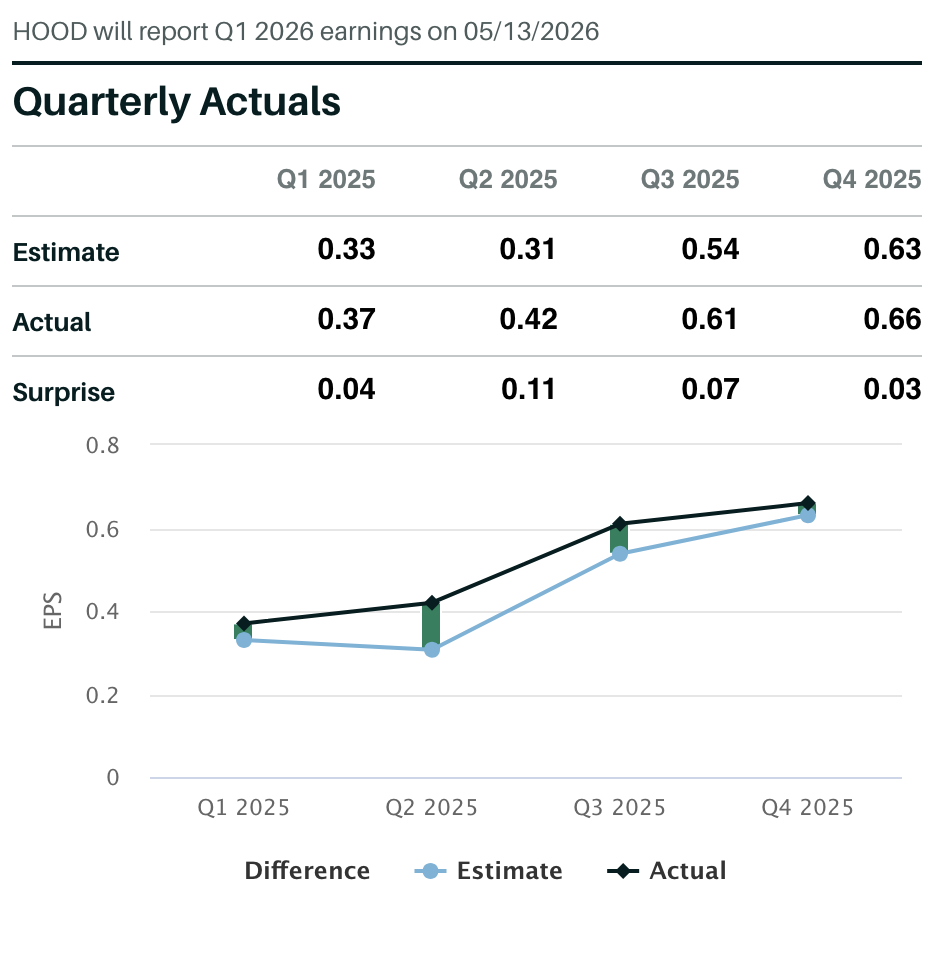
What the company delivered in 2025 was not a lucky quarter riding a crypto wave. It was $4.5 billion in revenue (up 52%), $1.9 billion in net income (EPS $2.04), $68 billion in net deposits, and 11 distinct business lines each generating over $100 million in annualized revenue. The business that investors still mentally associate with meme stocks now processes more options contracts than any U.S. brokerage, manages $324 billion in platform assets, and has 4.2 million paying Gold subscribers. This is not a trading app. It is a financial operating system.
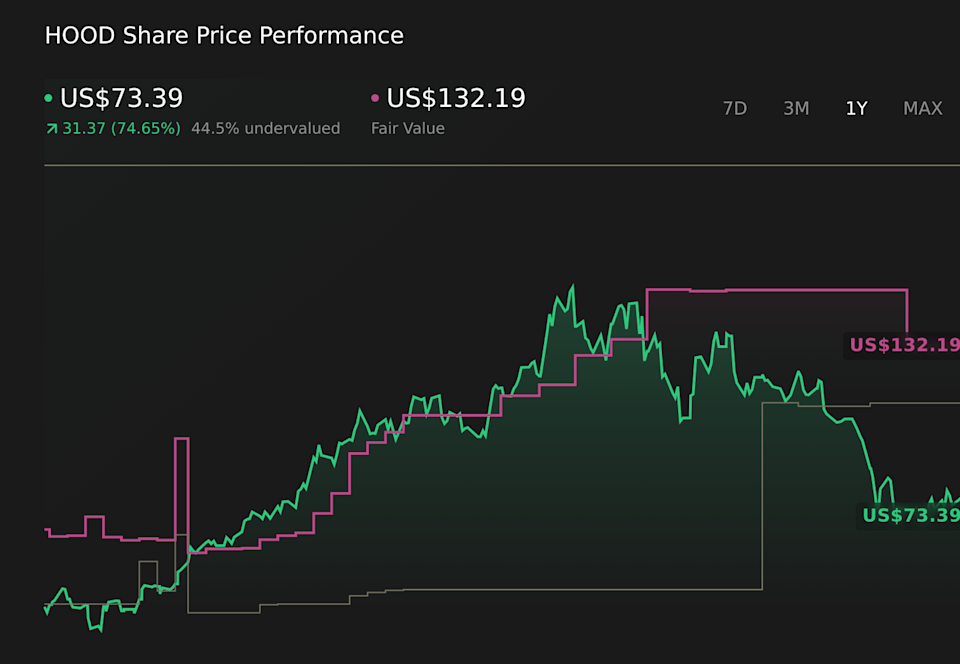
Yet here we sit. The stock has fallen 51% from its October 2025 highs. At roughly $72, you are paying approximately 29x forward non-GAAP earnings for a company growing revenue at 52%, with 56% adjusted EBITDA margins, a $1 billion buyback in place, and a product pipeline that includes private market access (Robinhood Ventures), AI-powered advisory (Cortex), social trading, a full-service bank, and international expansion into a $100 trillion wealth transfer. Coinbase, a company with narrower diversification and inferior forward growth estimates, trades at a 75% P/E premium.
The entry zone of $60-$70 reflects a view that the current pullback - driven by crypto cooling, macro uncertainty, and guilt-by-association with the broader fintech sell-off - has created a window where the stock price is telling the story of 2021, while the business is operating in 2026. This is the kind of disconnect that creates asymmetric risk-reward.
Robinhood at a Glance
Founded in 2013 by Stanford roommates Vlad Tenev and Baiju Bhatt, Robinhood's mission was deceptively simple: "Democratize finance for all." By pioneering commission-free trading, it forced the entire U.S. brokerage industry - from Schwab to Fidelity to E*Trade - to eliminate fees. The company went public in July 2021 at $38 per share, just months after the GameStop short squeeze that made it simultaneously famous and infamous.
What followed was a brutal reckoning. The stock plummeted as retail trading volumes cooled and interest rates rose, bottoming near $7.70 in 2022. Between 2022 and 2024, the company underwent a radical transformation - shifting from high-frequency transaction volume to long-term "sticky" assets, launching IRAs with generous matching programs, introducing the Gold subscription tier, acquiring Bitstamp for institutional crypto, and building an entirely new product suite. By late 2024, Robinhood achieved consistent GAAP profitability. By 2025, it delivered eight consecutive profitable quarters, with full-year net income reaching $1.9 billion.
The company now serves 27.4 million funded customers with 28.4 million investment accounts. Over 40% of total assets sit across ETFs, advisory, retirement and cash - not the speculative trading that defined the 2021 era. This is a company that has quietly, systematically rebuilt itself while the market's mental model remains stuck in the GameStop era.
The Transformation - From Trading App to Financial Super-App
The most important thing to understand about Robinhood in 2026 is that the company you remember from 2021 effectively no longer exists. That Robinhood was a single-product brokerage heavily reliant on payment for order flow from speculative options and crypto trades. The current Robinhood is a three-pillar financial platform with ambitions that directly overlap with Schwab, Fidelity, Coinbase, PayPal, and even Goldman Sachs' consumer division.
The transformation began in earnest in 2022 when the company launched IRAs with a 1% match (now 3% for Gold members) - an audacious move that signalled Robinhood wanted customers for decades, not days. The IRA match has proven to be one of the most effective customer retention tools in Robinhood's history. Over 40% of total platform assets now sit across ETFs, advisory, retirement and cash - a dramatic shift from the speculative trading that defined the 2021 era. Customers who open retirement accounts have measurably lower churn, higher average balances, and greater lifetime value.
"Over 40% of our total assets are now across ETFs, advisory, retirement and cash. It's great to see customers trusting us with more of their financial lives."
- Vlad Tenev, Q4 2025 Earnings CallThen came the Gold Card in 2024 - a 3% cash-back credit card that now has over 600,000 active users and $10 billion in annualized spend. Banking launched in late 2025, with over 25,000 funded customers bringing in $400 million in initial balances - and more than 50% enrolling in direct deposit, a remarkably high attachment rate for a product just months old. The Robinhood Strategies advisory product, the TradePMR acquisition bringing access to the $7 trillion RIA custody market, and the Legend desktop platform for advanced traders - all launched within the same 18-month window.
This velocity of product launches is what separates Robinhood from its peers. CEO Vlad Tenev articulated the strategy on the most recent earnings call with remarkable clarity: the goal is "wallet share" - the idea that a Robinhood customer should never need another financial app. And the data suggests it is working. Robinhood reported positive net transfers - positive inflows from all major brokerage competitors - for eight consecutive quarters. That is not a trading app statistic. That is a financial platform eating incumbents' lunch.
Revenue Architecture - Three Pillars, Eleven Business Lines
Robinhood's business model has evolved from near-total reliance on Payment for Order Flow to a balanced three-pillar structure. Understanding this architecture is essential because the most common bear argument - "Robinhood's revenue depends on crypto" - is only partially true, and the partial truth matters enormously when valuing the company.
Transaction-Based
Net Interest
Subscriptions & Other
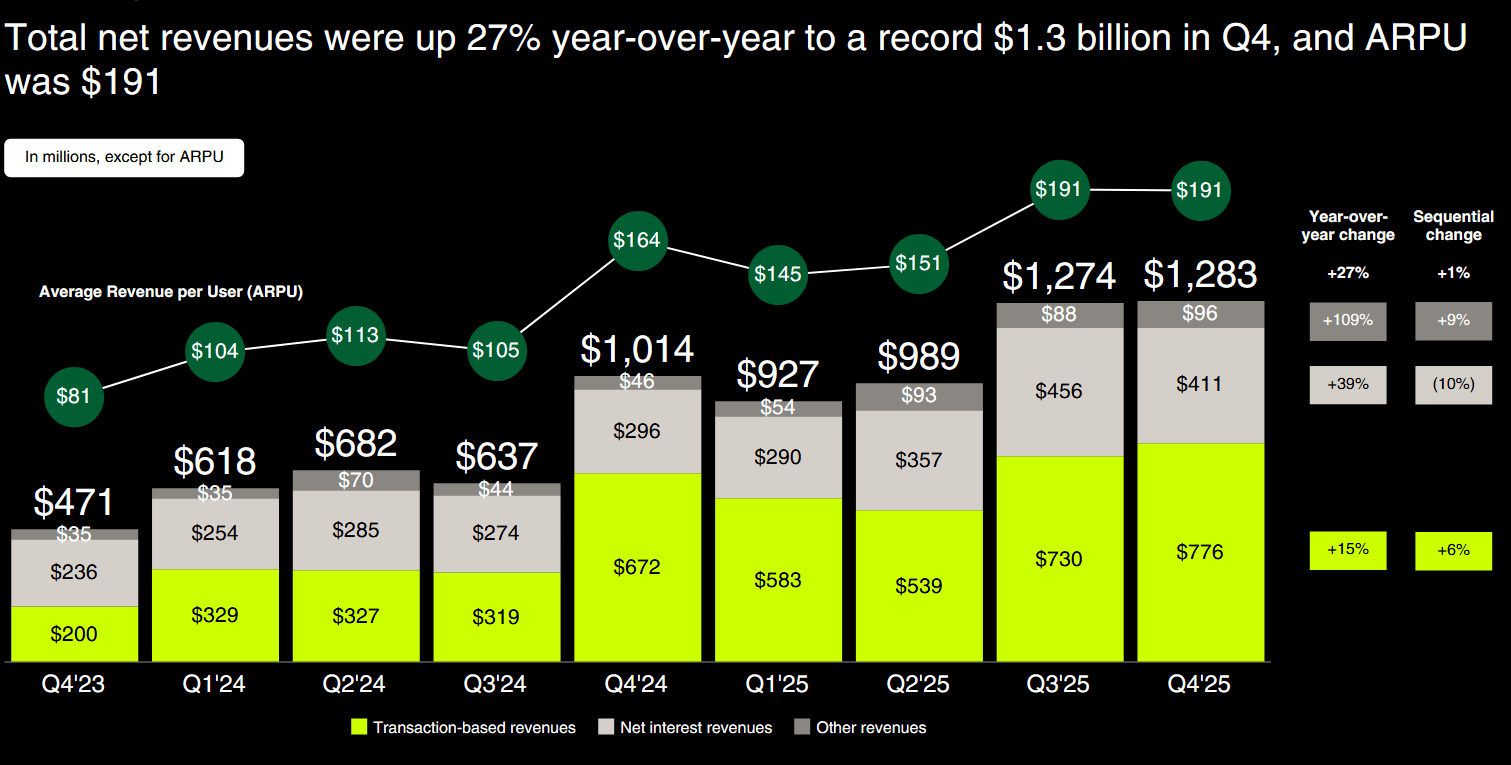
The critical insight here is the structural shift. In Q4 2025, crypto transaction revenue was $221 million - meaningful, but only 17% of total quarterly revenue. Compare that to the narrative that Robinhood "lives and dies by crypto." Even if crypto transaction revenue fell to zero (an extreme scenario), the company would still generate approximately $1.06 billion in quarterly revenue from equities, options, futures, event contracts, net interest, and subscriptions. That baseline, annualized, exceeds $4.2 billion - which is higher than the company's entire 2024 revenue.
ARPU (average revenue per user) tells the stickiness story. It reached $191 in Q4 2025 on a trailing twelve-month basis, up 16% year-over-year. This is not growth driven by adding cheap, low-engagement customers. It is growth driven by existing customers trusting Robinhood with more of their financial lives - more assets, more products, more activity. That is precisely the kind of growth that compounds.
Q4 2025 Earnings & the Numbers Behind the Narrative
The Q4 2025 results tell the story of a business whose flywheel is spinning faster than the stock price suggests. Full-year revenue of $4.5 billion represented 52% year-over-year growth - the second consecutive year of 50%+ revenue growth. Adjusted EBITDA reached a record $2.5 billion, with margins hitting 56%. Incremental EBITDA margins exceeded 70% for the third straight year, demonstrating that Robinhood's cost structure scales efficiently with revenue growth.
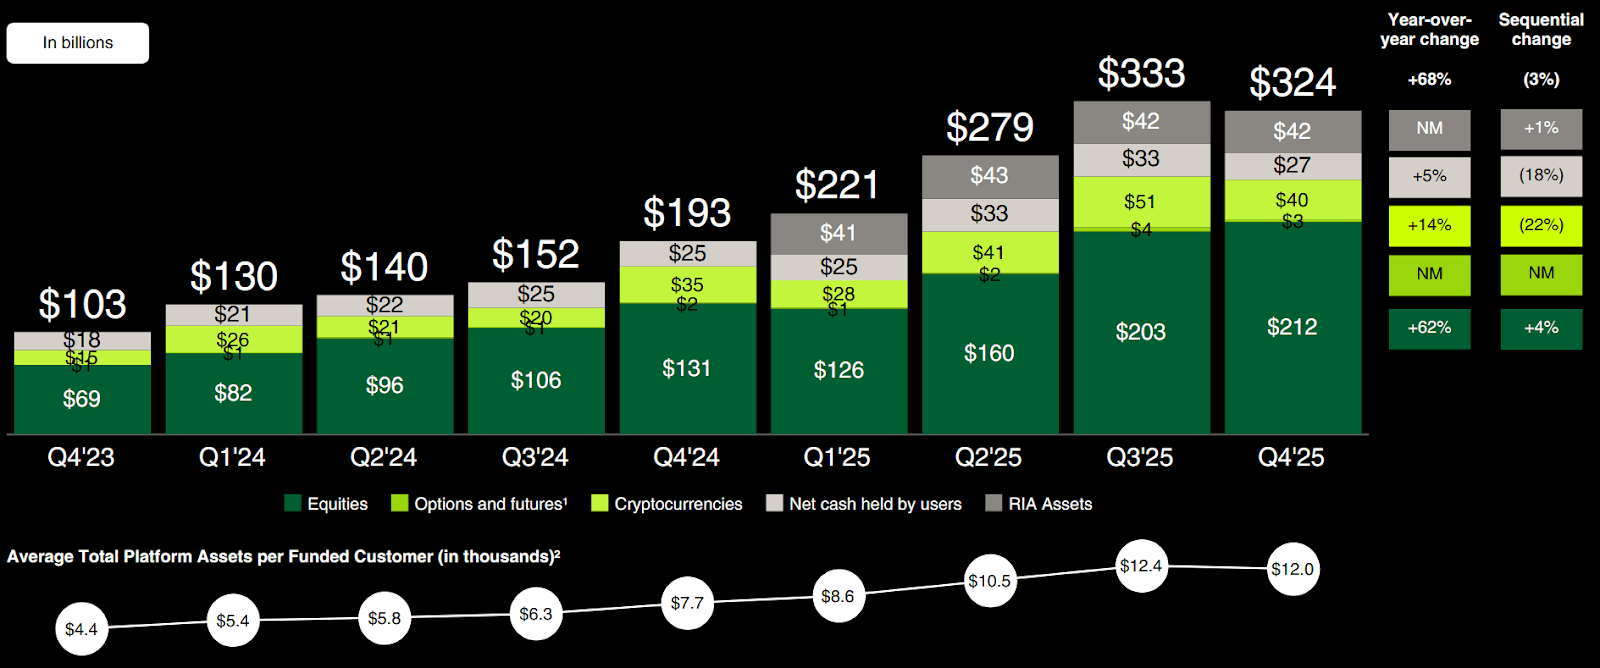
Net deposits of $68 billion for the full year represent a 35% annualized growth rate - meaning customers added $68 billion in fresh capital to the platform beyond market appreciation. To put that in context, Robinhood added in one year roughly the same amount of new assets that many regional banks hold in total deposits. Q4 alone contributed $16 billion, marking the eighth consecutive quarter above $10 billion in net deposits.
Importantly, this was not just a top-line story. Net income reached $1.9 billion for the full year. The company manages its share count carefully - EPS of $2.04 reflects not just earnings growth but capital discipline. CFO Shiv Verma emphasized that "the denominator matters," and Robinhood has a $1 billion+ share repurchase program that becomes especially powerful during periods of stock price weakness.
The Growth Moats - Prediction Markets, Ventures & AI
If the existing business were all there was, the valuation case would be straightforward. But what makes Robinhood genuinely exciting at this price level is the pipeline of businesses that are either in early stages of monetization or have not yet been reflected in estimates. These are not speculative "someday" features. They are live products with real traction and measurable data.
Prediction Markets - The Fastest-Growing Business in Robinhood's History
In its first full year, prediction markets generated a $300 million+ annualized revenue run rate. Customers traded over 12 billion contracts in 2025, and through early 2026, the pace has only accelerated - $4 billion in contracts traded in just the first weeks of the year. Vlad Tenev has described the company as being "at the start of a prediction market super cycle," and the data supports the enthusiasm.
The product pipeline here is deep. Rothera, the JV with Susquehanna, gives Robinhood vertical control over the exchange layer - controlling listing, pricing, and economics. The company plans to expand beyond sports into economics, financials, and lifestyle contracts. As CFO Shiv Verma explained at the Citizens JMP conference, "Our mental model is a digital newspaper and source of information - whether you're looking for economics, financials, lifestyle, sports - everything there is instantly and in real time." By mid-2026, Rothera should be operational, allowing Robinhood to capture the full economics of each contract traded rather than sharing with third-party exchanges.
Robinhood Ventures - Democratizing Private Markets
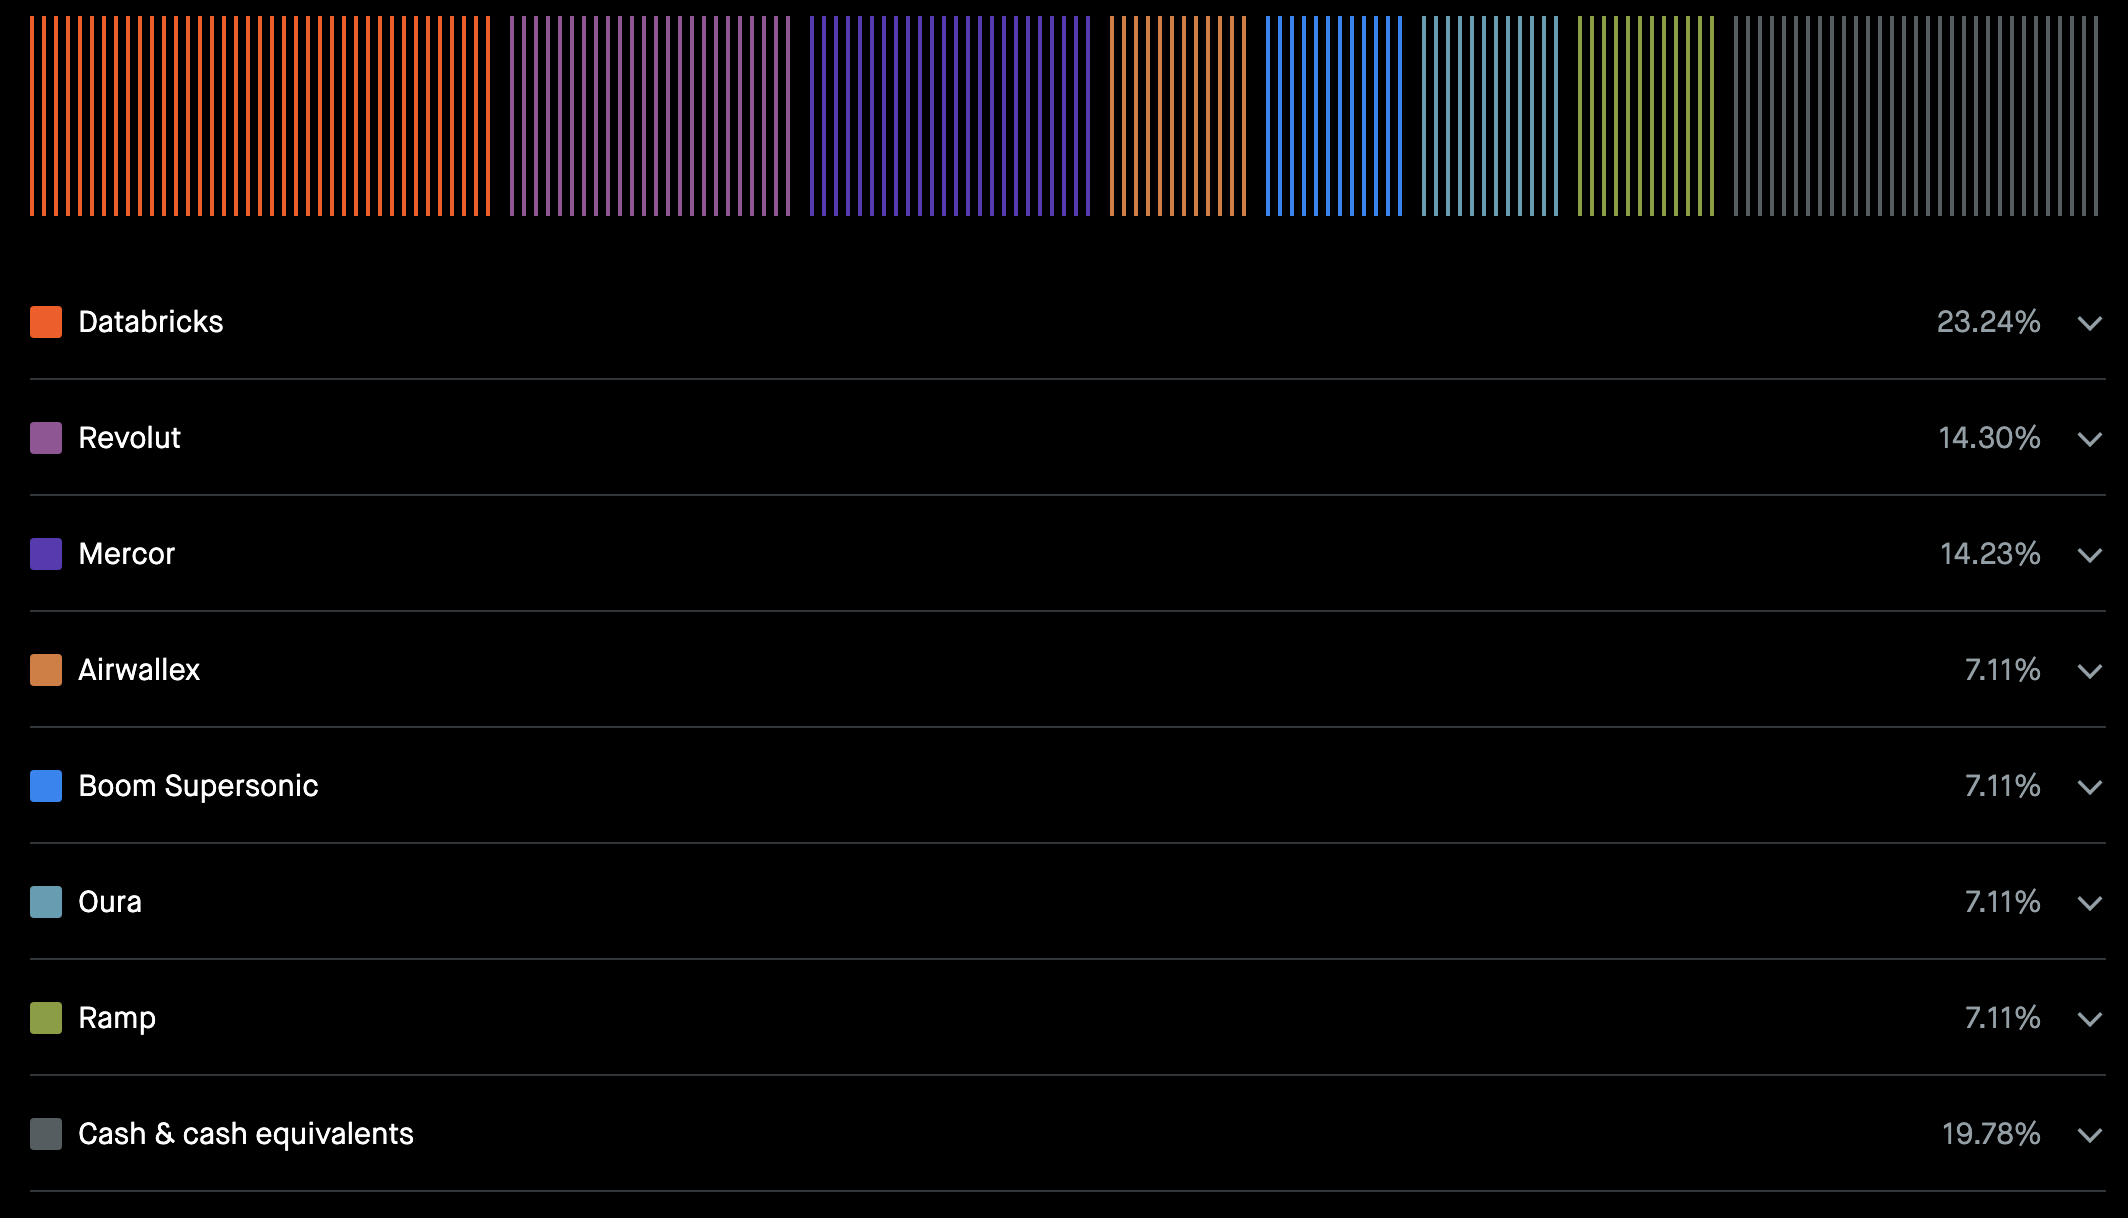
Robinhood Ventures Fund I (NYSE: RVI) began trading on March 6, 2026, marking the company's entry into asset management. The fund holds concentrated positions in Databricks (23.24%), Revolut (14.30%), Mercor (14.23%), along with Airwallex, Boom Supersonic, Oura, Ramp, and recently added Stripe and ElevenLabs. With 85-90% of Americans not accredited investors, the addressable audience for accessible private market exposure is enormous.
Shiv Verma has personally championed this initiative, noting that "private assets are the #1 thing customers want right now." The vision extends beyond a single fund - Robinhood sees itself as the retail gateway to all private market asset classes, including private equity, real estate, and credit, packaged in listed 40 Act funds with daily liquidity, no accreditation requirements, and low fees with no carry. If Robinhood Ventures succeeds at scale, it adds an entirely new revenue stream - fund management, custody, and the halo effect of becoming the platform where retail investors access pre-IPO companies.
Cortex AI - "What Cursor Is to Engineers, Cortex Will Be to Traders"
Robinhood is deploying AI aggressively across three vectors. Internally, about 75% of customer service tickets are now answered through AI - up from negligible levels just two years ago, with models continuing to improve. For consumers, Cortex Digests already synthesize portfolio movements and stock drivers, and the Cortex Assistant is rolling out in early 2026 as a general-purpose AI embedded throughout the app. For advanced traders, Cortex for Legend aims to be transformative - Tenev's own analogy of "what Cursor is to software engineers" reveals the ambition.
Robinhood has begun conversations with regulators about Cortex providing actual advisory recommendations to customers - a potential game-changer in the wealth management industry. If approved, it would mean a Robinhood customer could receive personalized, AI-driven portfolio advice at a fraction of what human advisors charge. This is not a distant dream; the technology exists today. The only gating factor is regulatory clarity around Reg BI rules.
Competitive Landscape - Why HOOD Over COIN
One of the most instructive ways to understand Robinhood's value is to compare it with Coinbase, its closest public market peer in terms of risk profile. Both companies have significant crypto exposure, both are transaction-heavy businesses with growing subscription revenue, and both face the same regulatory and macro risks. Yet the market prices them dramatically differently - and we believe incorrectly.
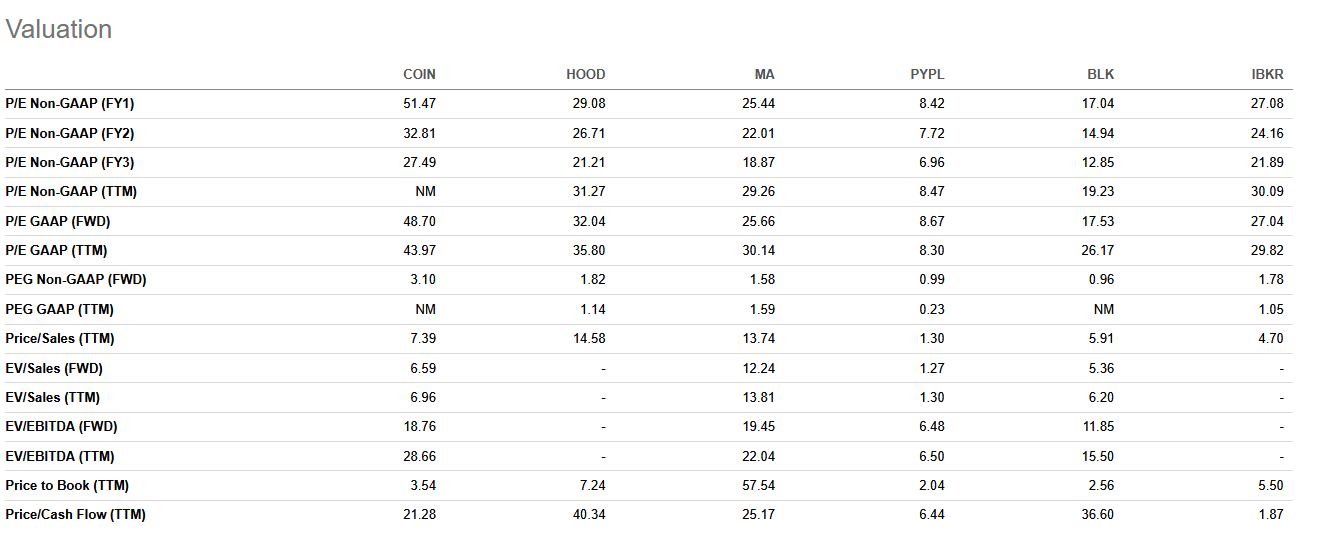
The valuation gap is stark and, in our view, unjustified. Coinbase trades at a 75% premium on forward P/E despite inferior growth, greater crypto concentration, and higher stock-based compensation dilution. The market's rationale - that Coinbase has more "institutional quality" revenue - holds some truth, but Robinhood's own institutional build-out (Bitstamp exchange, TradePMR custody) is rapidly closing that gap.
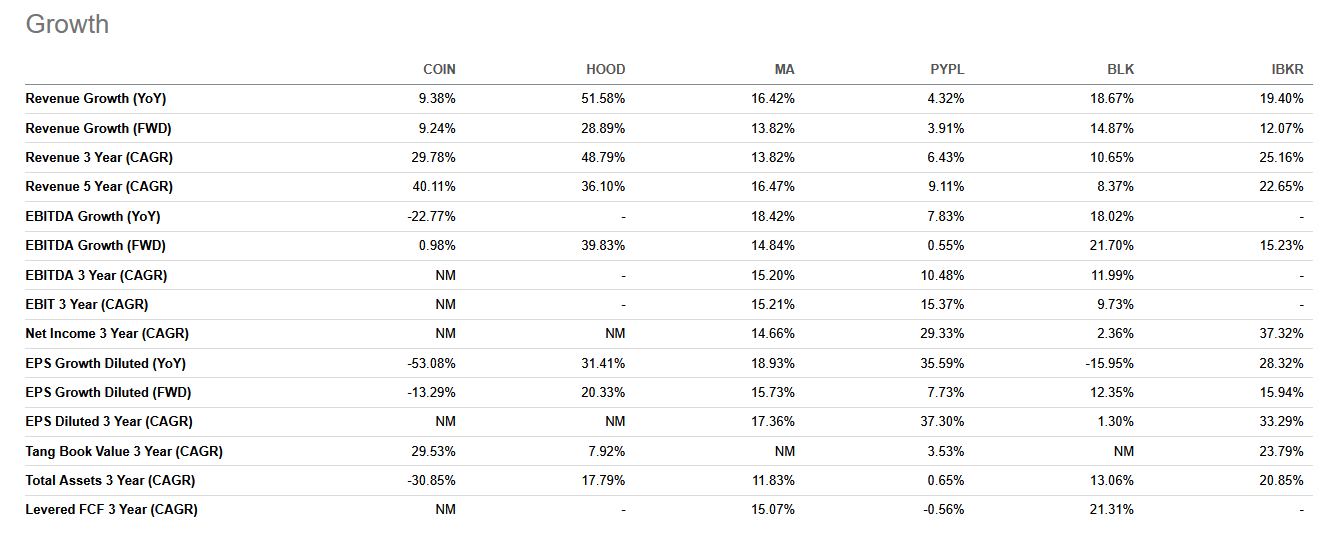
The estimated 2026 revenue growth tells a powerful story: the market expects HOOD to grow revenue 28.9% next year while expecting Coinbase revenue to decline 14%. This divergence reflects Robinhood's structural advantage - it is an equities, options, and crypto broker with prediction markets, banking, and advisory, while Coinbase remains predominantly a crypto platform. In a crypto downturn, both stocks suffer, but Robinhood has far more ballast.
Management Vision - Vlad Tenev's "Financial Super-App"
Vlad Tenev has made the journey from "disruptive founder under Congressional scrutiny" to "public company CEO executing a multi-year platform strategy." Whether you love or distrust the man, the strategic execution over the past two years has been objectively impressive. The three-arc strategy he outlined at Investor Day - #1 in active traders, #1 in wallet share for the next generation, and #1 global financial ecosystem - is being methodically executed.
"We've had positive net transfers - positive inflows from all of our major brokerage competitors - for the last 8 quarters in a row. We think we've got a lot of headroom here."
- Vlad Tenev, Q4 2025 Earnings CallThe recent addition of CFO Shiv Verma - an 8-year Robinhood veteran who architected much of the growth strategy - adds continuity and credibility. At the Citizens JMP conference, Verma articulated a financial North Star with clarity unusual for a fintech CFO: "What are we optimizing for shareholders? Earnings per share, free cash flow per share over time. That's how you should judge us." The expense outlook for 2026 - 18% growth at the midpoint, below the 22% rate of 2025 - signals continued operating leverage, with more than half of incremental spending directed toward new businesses (Gold Card, Banking, Cortex, Ventures, international).
Tenev has also positioned himself as a thought leader on AI and the future of work, introducing the concept of a "job singularity" at a recent TED Talk - a period of rapidly accelerating job creation where AI enables individuals to operate with capabilities comparable to full organizations. This is not idle philosophizing. It connects directly to Robinhood's product vision: if one person can run an investment operation that previously required a team, they will need a platform that handles trading, banking, advisory, tax optimization, and custody in one place. That platform is what Robinhood is building.
Valuation - What the Numbers Say
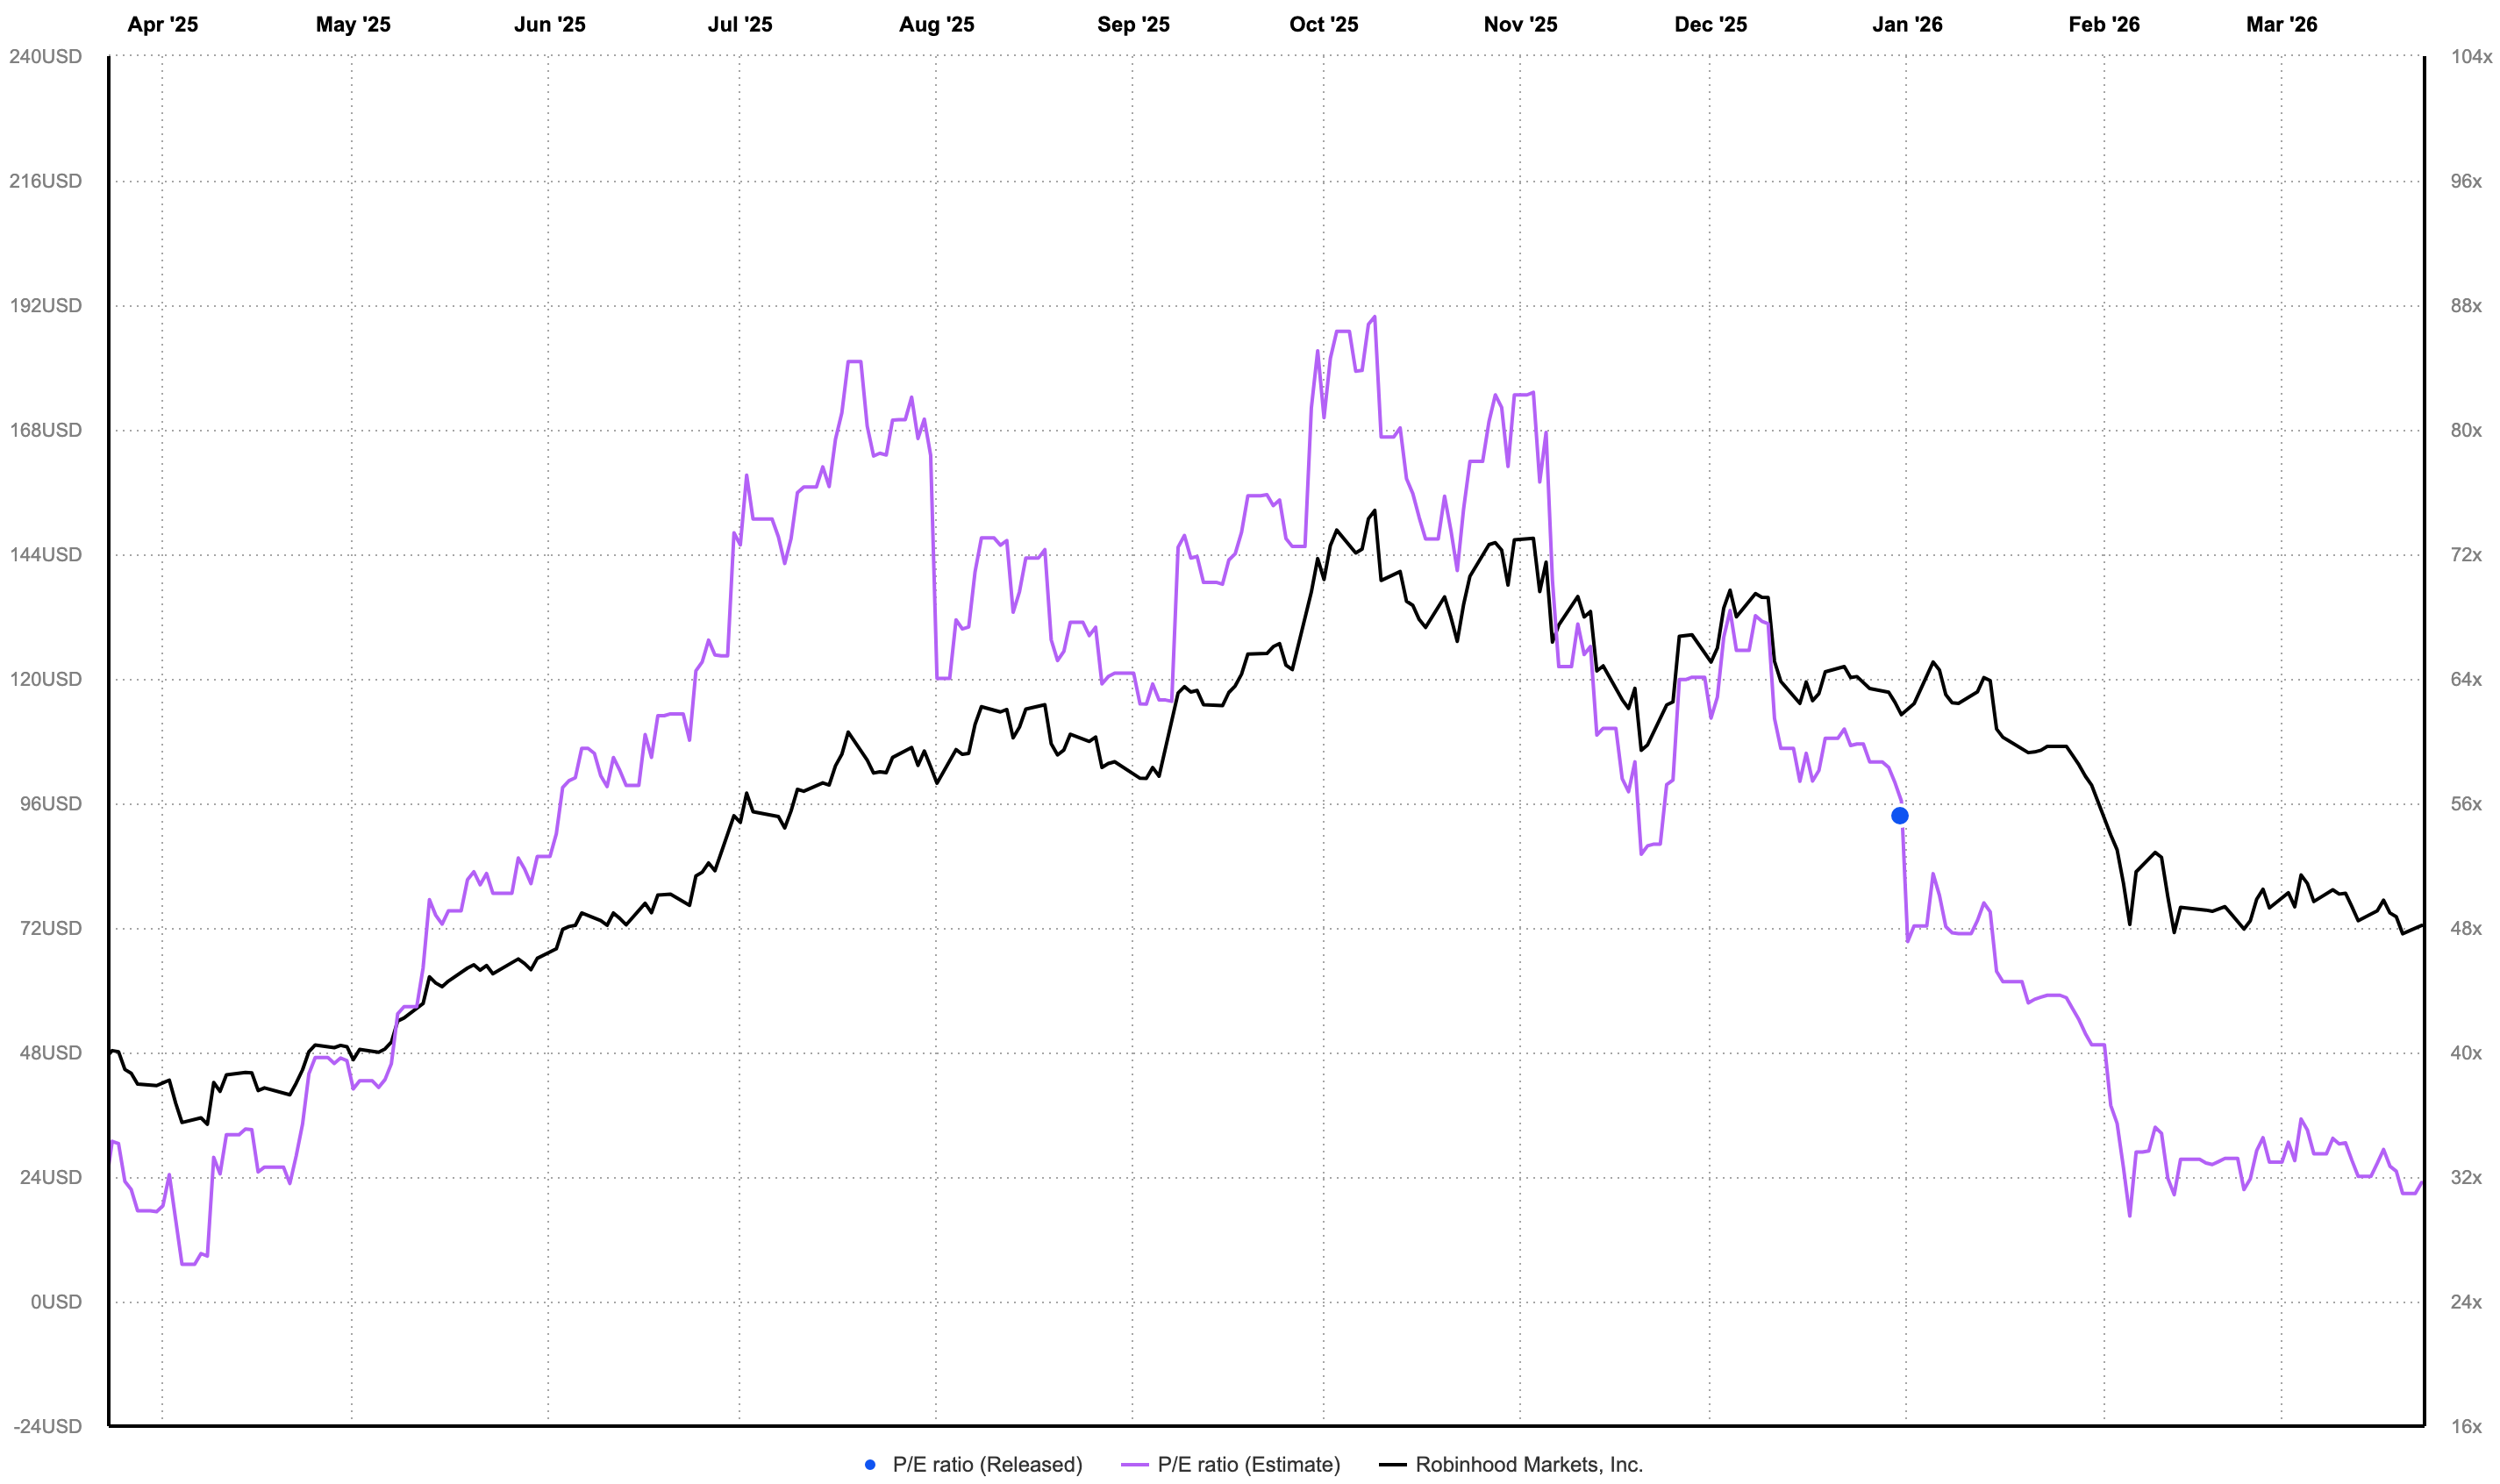
At approximately $72 per share, Robinhood trades at roughly 29x forward non-GAAP earnings (FY1) and 26.7x FY2 earnings. The trailing P/E on a GAAP basis is approximately 35x. These are not "cheap" multiples in the traditional sense - but they must be evaluated against a 52% revenue growth rate, 56% adjusted EBITDA margins, and a pipeline of new business lines that are not yet fully reflected in consensus estimates.
The Simply Wall St fair value model, which has been recently trimmed by 6% to $124.62, uses a long-run revenue growth assumption of 18.4% and a future net margin of 43.4%. Goldman Sachs, BofA, Cantor Fitzgerald, Mizuho, and Argus all maintain positive ratings, with price targets ranging from $120 to $130. The consensus "Moderate Buy" with a fair value in the $124 range implies approximately 70% upside from current levels.
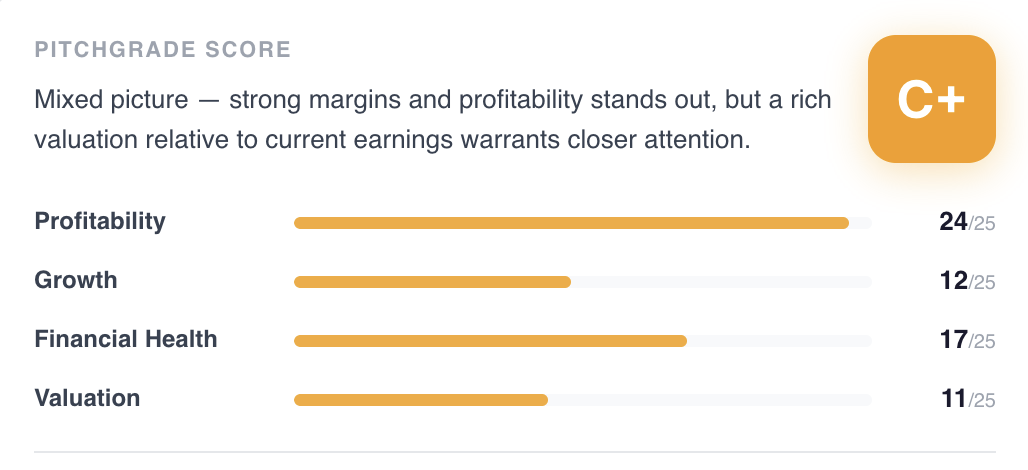
The critical question is not whether Robinhood is "cheap" on a multiple basis - it is not, by historical brokerage standards. The question is whether the multiple is appropriate for the growth rate and the quality of that growth. A PEG ratio of 1.82 (using forward non-GAAP P/E and forward EPS growth) compares favorably to Coinbase at 3.10, Mastercard at 1.58, and Interactive Brokers at 1.78. In other words, you are paying a similar growth-adjusted premium to IBKR and a significant discount to COIN for a company that is growing faster than both.
What the Market Sees vs. What the Business Shows
- Crypto winter reduces transaction revenue significantly
- Payment for Order Flow faces regulatory ban risk
- Interest rate cuts compress NIM revenue
- Prediction markets are a fad - post-NFL season volume collapses
- Customer base is speculative "dumb money" that churns
- Robinhood can't compete with Schwab/Fidelity for serious money
- The stock was wildly overvalued at $150+, still has further to fall
- 51% decline means something is fundamentally wrong
- Crypto is 17% of Q4 revenue - and declining as % of total mix
- CLARITY Act softened PFOF ban risk; transparency approach adopted
- Rate cuts grow margin lending demand and deposit attractiveness
- NBA volume surpassed NFL; non-sports contracts growing fast
- 40%+ of assets in ETFs/retirement/advisory - not meme stocks
- 8 straight quarters of positive net transfers FROM competitors
- At $72, fwd P/E is 29x with 52% revenue growth - cheapest since IPO on growth-adjusted basis
- Business metrics improved every quarter while stock fell
The Bear Case - Addressed Honestly
Every intellectually honest research note must steel-man the bear case. HOOD has already corrected over 50% from its October highs, and the bearish camp argues that further downside remains "the path of least resistance." After a run from $7 to $153 in under two years, the skepticism is understandable. These arguments deserve a full hearing - and a full rebuttal.
Bear Argument #1: Crypto revenue is unreliable. This is partially correct. Crypto transaction revenue fell 38% year-over-year, from $358 million in Q4 2024 to $221 million in Q4 2025. The pattern mirrors 2021 - a speculative surge followed by a hangover. However, the difference between 2021 and 2025 is that crypto represented over 50% of transaction revenue at the 2021 peak versus approximately 28% at the 2024 peak. The business has structurally diversified. Moreover, even after the 38% decline, crypto revenue of $221 million in Q4 2025 was still higher than any quarter before Q3 2024. The revenue floor has risen dramatically.
Bear Argument #2: Monthly active users declined in 2025. This is true - but misleading without context. MAU is a lagging and incomplete metric for Robinhood's current model. The company is optimizing for wallet share per customer, not active user count. ARPU rose 16% to $191, net deposits grew 35%, and total platform assets rose 70%. The customers who remain are spending more, depositing more, and using more products. A business that trades MAU for wallet share is not declining - it is maturing.
Bear Argument #3: Prediction markets depend on sports gambling. Early data suggests otherwise. In January, NBA contracts surpassed NFL in trading volume. The government shutdown contract generated significant non-sports volume after the NFL season ended. The Olympics, World Cup, March Madness, and expanding non-sports categories all provide a broader base than "football season." Still, the bear is right that this is a young product and seasonal risk exists - we factor this into our base case.
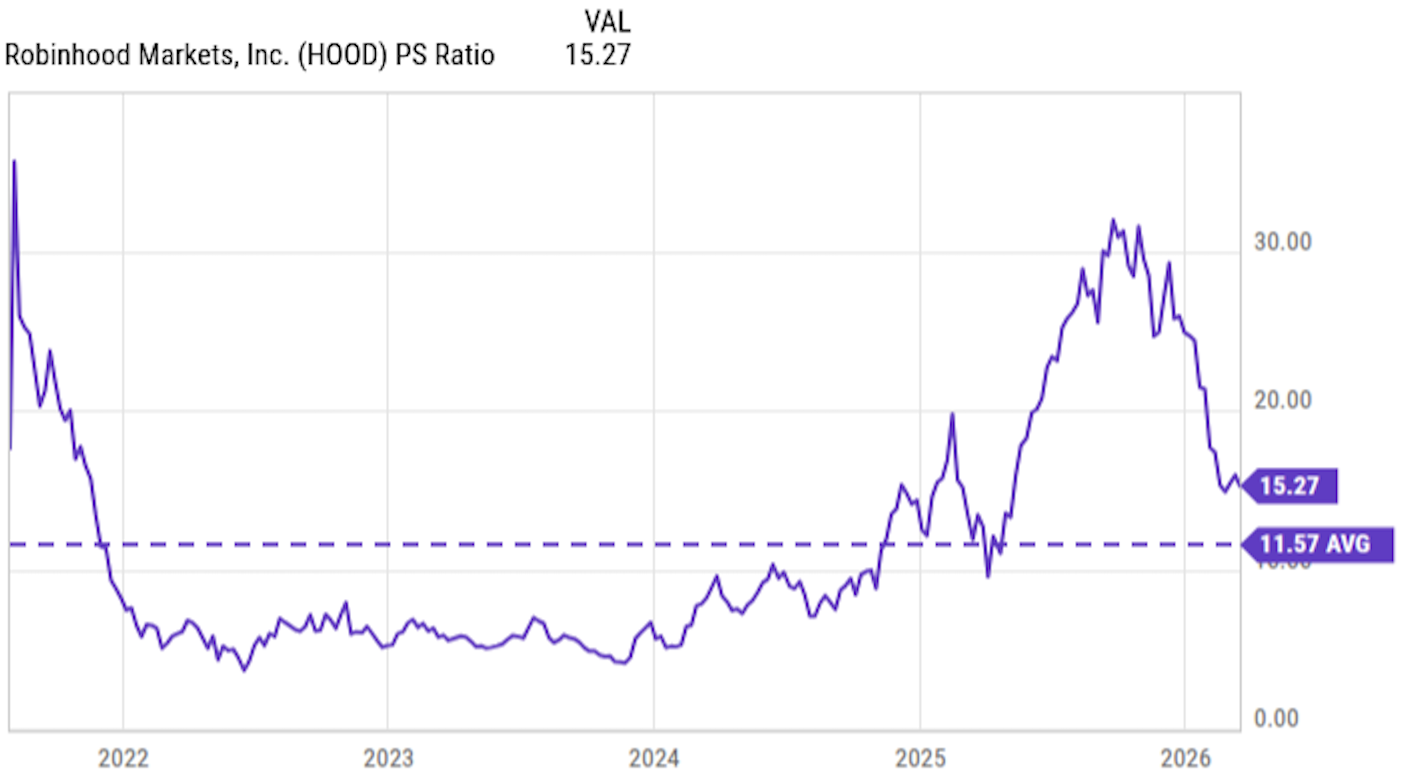
Bear Argument #4: The P/S ratio is still elevated. At 15.3x trailing sales, the stock sits above its post-IPO average of 11.5x. However, that average incorporates periods when Robinhood was unprofitable and shrinking. The 2022-2023 period, when P/S was 3-5x, reflected a company with negative earnings and declining users. Using those years to calculate a "fair" P/S and applying it to a company generating $1.9 billion in net income is analytically flawed. The correct comparison is P/E - and at 29x forward earnings with 28.9% forward revenue growth, the multiple is reasonable.
Technical Structure
The technical picture confirms what the fundamental analysis suggests: the stock is deeply oversold relative to its underlying trend. HOOD has corrected 51% from its October 2025 peak of approximately $153.86, now trading near $72.49. All major moving averages are above the current price - the 20-day SMA at $76.61, the 50-day at $86.99, and the 100-day at $108.15. The stock is trading significantly below its 100-day moving average, a condition that has historically preceded recoveries rather than further collapses for fundamentally strong companies.
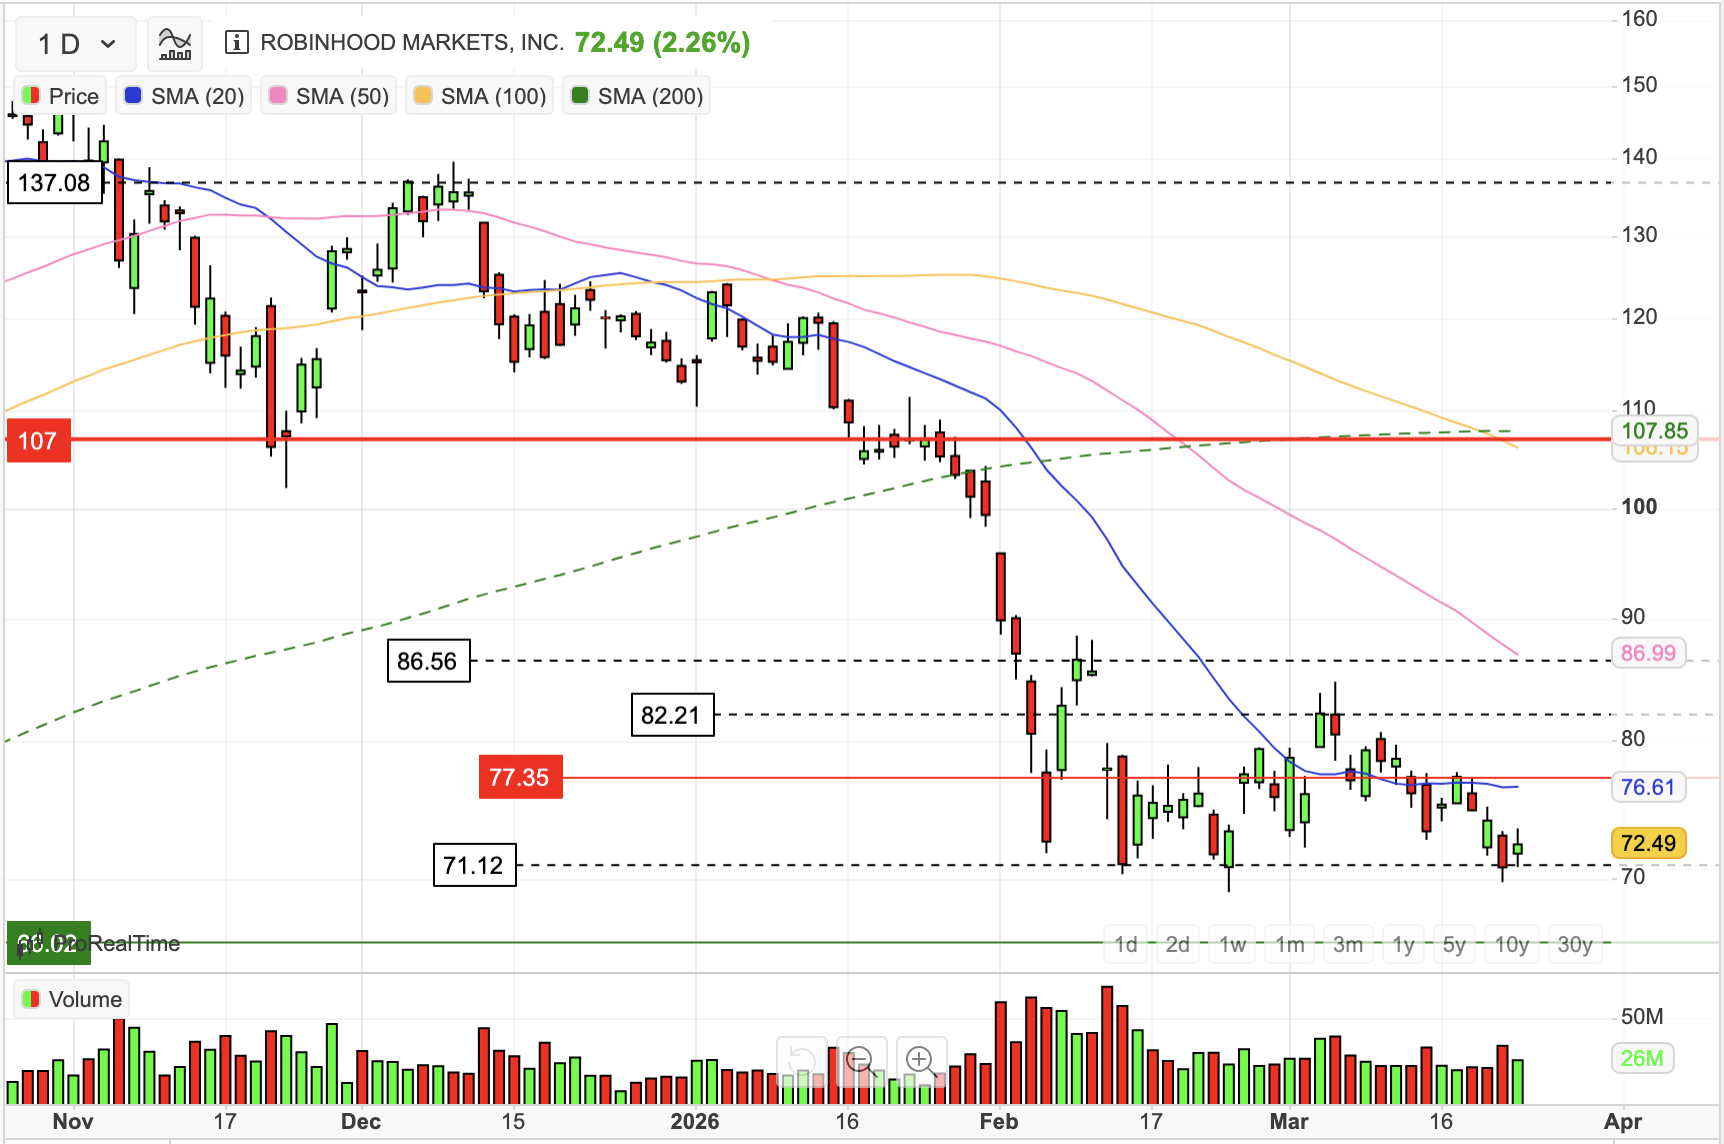
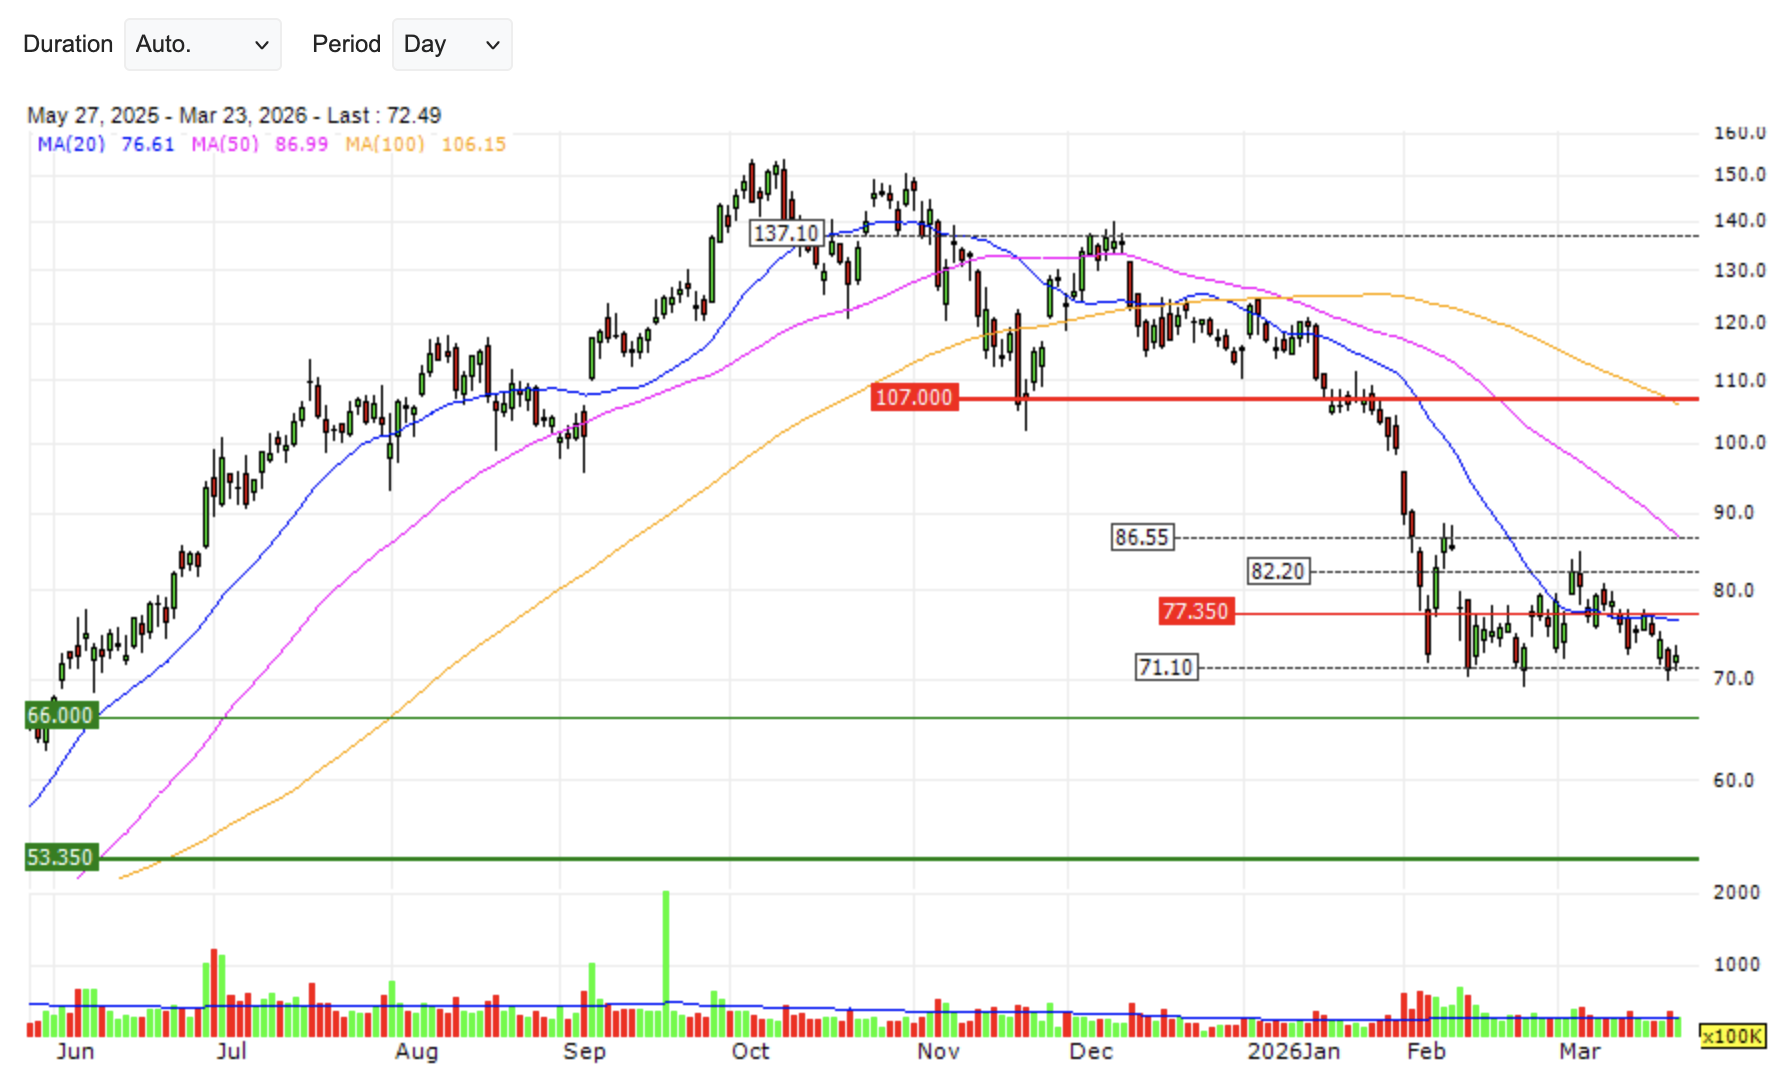
Key technical levels to monitor: immediate support at $71.12 (March 2026 low), with deeper support at the $53.55 demand zone where significant buying volume accumulated in mid-2025. On the upside, the first resistance cluster sits at $77.35 and $82.70, followed by $86.55 (near the 50-day SMA in pink). The pivotal level is $107 - the red horizontal on both charts - which aligns with the 100-day moving average and represents a major structural resistance. A decisive reclaim of $107 would likely trigger institutional buying and confirm the correction is over.
Scenario Analysis
Our three-scenario model uses consensus EPS estimates, reasonable P/E assumptions based on the company's growth trajectory, and adjustments for macro conditions. The scenarios are anchored to an entry price of approximately $65 (the midpoint of the $60-$70 entry zone).
Bear Case
Prolonged crypto winter, interest rate cuts compress NIM faster than deposits grow, prediction markets plateau post-NFL, macro recession dampens trading activity. P/S reverts toward 11.5x average.
Base Case
Revenue grows 20%+ in 2026, prediction markets scale, Ventures launches successfully, Gold subscribers exceed 5M, banking and credit card gain traction. Multiple stable at 28-30x as growth quality is recognized.
Bull Case
Crypto recovery, prediction market super cycle materializes, international expansion accelerates, Cortex AI advisory approved by regulators, tokenization gains traction. Robinhood re-rated as a platform, not a brokerage.
Catalyst Calendar
Risk Register
Crypto Winter / Extended Drawdown
Total crypto market cap has fallen from $4.4T to $2.5T. If Bitcoin and Ethereum continue declining, crypto transaction revenue could fall further, impacting both revenue and sentiment. The stock remains correlated to BTC despite diversification.
Macro Recession / Trading Volume Decline
A broad economic downturn could reduce trading activity across all asset classes, compress interest-earning assets, and pause the wealth transfer that Robinhood is positioning to capture.
Interest Rate Sensitivity
Net interest income (~$1.5B) benefits from higher rates. Rapid Fed cutting would compress this revenue. However, lower rates also increase margin lending demand and deposit attractiveness - partially offsetting the impact.
Regulatory Risk (PFOF, Crypto)
Payment for order flow remains politically sensitive. While the CLARITY Act reduced ban risk, future regulatory changes could still impact transaction-based revenue. FINRA fined Robinhood $26M in March 2025.
Robinhood Ventures Execution Risk
RVI's concentrated portfolio includes Revolut at a possibly stretched $75B valuation. Fintech IPOs (Webull, Klarna) have underperformed. A downward revaluation of key holdings could hurt fund performance and brand credibility.
Competition from Schwab / Fidelity
Legacy brokerages manage trillions and have deeper product suites. However, their average customer is 50+ years old. Robinhood's demographic moat (average age 35) and digital-native UX provide structural protection in the wealth transfer generation.
Scenario Modeling
- Scenario Entry Range: $60-$70. Build in tranches. Tranche 1 (50%) at current levels ($70-$72). Tranche 2 (30%) on any pullback toward $62-$66. Tranche 3 (20%) in reserve for a potential flush toward $55-$60 on broad market risk-off.
- Risk Consideration: This is a moderate-to-high risk position due to crypto correlation, multiple compression risk, and macro sensitivity. 3-5% of a diversified portfolio is appropriate. The stock can be volatile on daily moves of 3-5%.
- Upside Milestones: First exit (30%) at $106-$110 - major moving average reclaim and first major horizontal resistance. Second exit (40%) at $118-$126 - mid-to-upper target zone, analyst consensus fair value. Final exit (30%) at $130+ - full re-rating toward bull scenario.
- Thesis Invalidation Level: $48. A sustained close below this level would imply the market is pricing in structural revenue decline or regulatory disruption. Below this level, the risk/reward no longer favors the position.
- Key Monitoring Points: Monthly operating data releases (funded customers, net deposits, trading volumes); quarterly earnings beats/misses; crypto market direction (BTC as proxy); prediction markets volume trends post-NFL; Robinhood Ventures fund performance; international customer growth; Gold subscriber count trajectory.
Final Thought - The Second Act Is Being Mispriced
The market has a long memory but a short attention span. It remembers January 2021 - the trading halts, the Congressional hearings, the $7.70 stock price. It remembers that Robinhood customers are "meme stock traders" and that the company "depends on crypto." These memories are not wrong. They are just irrelevant to the company that exists today.
The Robinhood of March 2026 generates $4.5 billion in revenue, $1.9 billion in net income, and 56% adjusted EBITDA margins. It has $324 billion in platform assets, $68 billion in annual net deposits, 4.2 million paying subscribers, and 11 business lines each generating over $100 million annually. It is the #1 options brokerage in the United States. It has positive net transfers from every major competitor for eight consecutive quarters. It has entered prediction markets, private equity, banking, credit cards, AI advisory, and international expansion - all within 18 months.
The stock has fallen 51% because crypto cooled, macro uncertainty increased, and the entire fintech sector de-rated. These are real headwinds. But they are cyclical headwinds being applied to a structural growth story. The bear case - that Robinhood is a speculative trading app priced for a crypto bull market - was valid in 2021. It is not valid in 2026. The business has structurally diversified, and the market has not yet adjusted its mental model.
When seven independent analyst groups (Seeking Alpha contributors, Simply Wall St quantitative models, Goldman Sachs, Truist, JPMorgan, Cantor Fitzgerald, and Mizuho) converge on a fair value range of $120-$132 from different methodologies - growth DCF, comp analysis, sum-of-parts, momentum models - that convergence carries analytical weight. No single model is reliable in isolation. When they all point in the same direction from different starting assumptions, it suggests the current price is meaningfully dislocated from the business value.
The $60-$70 entry zone reflects our view that the risk-reward is asymmetric: the downside to the bear case ($48-$55) is 15-25%, while the upside to the base case ($106-$126) is 63-94%. The bull case ($140-$165) offers more than 100% upside from current levels. For a company growing revenue at 50%+ with expanding margins, eight consecutive quarterly earnings beats, and a product pipeline that rivals any fintech in the world, that is the kind of setup that does not come around often.
Robinhood is not the rebel at the gate anymore. It is building the gate. The question is not whether the market will recognize this - it is when. And at $60-$70, the risk of being wrong is far smaller than the cost of missing the re-rating when it comes.
Important Disclaimer
This content is for informational and educational purposes only and does not constitute financial advice, investment recommendations, or solicitation to buy or sell any securities. Past performance does not guarantee future results. All investments carry risk, including the possible loss of principal. Robinhood Markets, Inc. (NASDAQ: HOOD) is subject to market risk, crypto market risk, interest rate risk, regulatory risk including potential changes to Payment for Order Flow regulations, competitive risk from established brokerages, and execution risk on new product launches. The stock has high beta and is correlated with crypto market sentiment. Revenue from transaction-based sources is inherently volatile and may decline significantly during periods of reduced trading activity. Earnings estimates, price targets, and fair value calculations cited in this analysis are based on publicly available information and independent analytical models as of March 2026; actual results may differ materially. The entry and target zones reflect scenario-based analysis, not price predictions. Always conduct your own due diligence and consult a qualified financial advisor before making any investment decision.