Consider PREMIUM MEMBERSHIP to get upfront access to undiscovered trends shaping future markets - and success to make informed decisions. Unsubscribe anytime.
Market Tips with detailed scenario analysis and research
Scenario analysis, research breakdowns and respective target zones
Industry & sector research with full fundamental & technical analysis
We've sent you a confirmation email. Click the link to activate your free access.
Something went wrong. Please try again.
AI Infrastructure - Large Cap
SMCI - Inside the AI Factory Machine: Platform Transition, Not Structural Failure
Super Micro Computer, Inc. (NASDAQ: SMCI)
February 6, 2026 9–12 Months High Conviction - High Risk
Outlook
Bullish
Time Horizon
9–12 Months
Scenario Entry Range
$29–$32
Target Zone
$45–$55
Risk / Reward
~1 : 2.5
Morning Brief · Equity Research · Technology Hardware · February 6, 2026
TO:Portfolio Committee
FROM:Research Desk
TICKER:SMCI (NASDAQ)
ACTION:INITIATE LONG
ENTRY RANGE:$29.00 – $32.00
TARGET RANGE:$45.00 – $55.00
STOP-LOSS:$22.00 (hard)
CONVICTION:HIGH
Super Micro just delivered the largest quarter in company history - $12.7 billion in revenue, +123% year-over-year - yet the stock sits 75% below its all-time high and at 0.5x forward revenue. The market's thesis is that SMCI is a structural commodity trap: squeezed by NVIDIA above and hyperscalers below, with no durable moat. We disagree. The DCBBS product suite - Data Center Building Block Solutions at 20%+ gross margins versus the company's 6.4% core server rate - is not a rounding error. It is the entire thesis. This is a platform transition being mispriced as a permanent impairment. The entry is asymmetric: hard stop at $22 limits downside to ~31%; base case of $45 delivers ~40% return in 9–12 months.
The Setup
The Market's Misread - Why Now
There is a version of the SMCI story that ends badly: a commoditised hardware assembler in permanent margin compression, addicted to a single hyperscale customer, with no pricing power and a governance history that burned investors. That version trades at a mid-single-digit P/E and stays there. It is the story the market has been telling for eighteen months.
We think the market has correctly identified the symptoms - thin margins, customer concentration, accounting uncertainty from 2024 - but has drawn the wrong conclusion. It is treating cyclical and transitional headwinds as permanent structural failures. What looks like a broken business model is, in our reading, a company mid-migration from SMCI 3.0 (rack-scale servers) to SMCI 4.0 (full data centre building block solutions) - a transition that compresses near-term margins while building the foundation for a fundamentally different unit economics profile.
On February 3, 2026, SMCI delivered its clearest evidence yet. Revenue of $12.68 billion beat consensus by $2.3 billion - a 22.6% positive surprise. Non-GAAP EPS of $0.69 beat by $0.20, a 41% upside surprise against guidance of $0.46–$0.54. Full-year guidance was raised to at least $40 billion, more than 10% above the prior floor. This is not the behaviour of a structurally impaired business. This is a company executing through a difficult platform transition, and the market cap - roughly $19 billion against $40 billion in revenue guidance - prices it as if the worst is permanent.
We are initiating a long at $29–$32 with a 9-to-12-month horizon. Our base-case target is $45, approximately 40% above our entry midpoint. Our conviction is high, our position sizing is disciplined, and our hard stop is $22.
Market Structure
Position in the Value Chain - The Squeeze
Understanding the bear case structurally - and why DCBBS is the escape route
NVIDIA Monopoly Pricing Power
Commands premium pricing on GPUs, accelerators, and platform IP. SMCI has no leverage to negotiate - it absorbs or passes through NVIDIA costs. As new platforms launch (GB300, Vera Rubin), SMCI faces expedite costs on every ramp cycle.
🔵
▼ value flows down ▼
Super Micro Computer Our Position
32-year engineering heritage. First-mover on Direct Liquid Cooling (DLC) - one generation ahead of reference architecture. Preferred NVIDIA integration partner. Being squeezed from both sides - today. DCBBS is the escape route: a proprietary product set with 20%+ margins that moves SMCI from assembler to total solution provider.
🏭
▼ pricing pressure from below ▼
Hyperscalers Monopsony Buyers
Enormous negotiating power. One unnamed client = 63% of Q2 FY26 revenue. They demand the lowest possible price for rack systems. Price taker relationship forces SMCI to sacrifice margin to retain volume.
🌐
This is the bear case - visualised. DCBBS moves SMCI up and out of the commodity squeeze, directly competing with Vertiv (29.6× P/E) instead of Dell (9.3× P/E).
Q2 FY2026 Results
Financial Dashboard
Quarter ended December 31, 2025 · non-GAAP unless noted · Reported February 3, 2026
What the numbers actually say: SMCI massively beat every metric - revenue, EPS, and guidance. The one failure was gross margin. Our thesis is that the margin trough is a confluence of three temporary factors: new platform (GB300) expedite costs, a single hyperscale customer at 63% concentration driving down pricing, and component shortages from extraordinary demand growth. All three are acknowledged by management and guided to improve. Q3 is already tracking better.
The Core Thesis
The DCBBS Option - The Hidden Margin Engine
If there is one disclosure from the February 3 earnings call that the market is systematically underweighting, it is this: DCBBS - Data Center Building Block Solutions - already delivers gross margins above 20%, and management guided for double-digit profit contribution by end of calendar 2026. In H1 FY26, DCBBS was just 4% of total company profit. Small enough to ignore in near-term consensus models. Enormous in terms of what it signals about the margin trajectory.
Consider the analogy carefully. Vertiv Holdings (VRT), which provides exactly this type of full-stack data centre infrastructure - cooling, power, networking, software - trades at a forward P/E of 29.6× with gross margins above 35%. SMCI's core server business trades at 11.6× forward earnings with 6.4% margins because the market correctly classifies it as a commodity assembler. DCBBS is SMCI's Vertiv moment. The products are real: CDU liquid cooling systems, chilled doors, power shelves, battery backup, cooling towers, generators, 400G/800G switching, SuperCloud management software - a complete, pre-validated data centre in a box, deployed already at the world's first GigaWatt data centre. The transition is underway; the market hasn't priced it.
CEO Charles Liang confirmed margins on DCBBS are "more than 20%" and emphasised the product line as SMCI's fourth evolution as a company - from components (1.0) to servers (2.0) to rack-scale solutions (3.0) to total data centre infrastructure (4.0). The question is not whether this is real. It is already shipping in volume. The question is speed of adoption - and the structural tailwind of $600B+ in hyperscaler CapEx for 2026 suggests the demand environment will pull that adoption forward.
6.4%
Core AI Server Business - Today's Trough
Hyperscale customer concentration + GB300 expedite costs + component shortages. Management: Q3 already guided +30bps. December quarter was "the low watermark."
Now
8–9%
Blended Rate - DCBBS Mixing In
DCBBS growing toward 10%+ of profit share. Expedite costs normalise post-GB300 ramp. Enterprise channel diversification (+42% YoY) adds higher-margin accounts. Federal Business Unit begins contributing.
6–9 Months
>10%
Target Blended - DCBBS at Scale
CEO: "Double-digit net margin as soon as possible." DCBBS reaches double-digit profit contribution. Vera Rubin upgrade cycle begins in H2 2026 driving new revenue pull. Customer diversification reduces the hyperscale concentration discount.
9–12 Months
Technical Analysis
Chart Setup - Two Time Horizons, One Conclusion
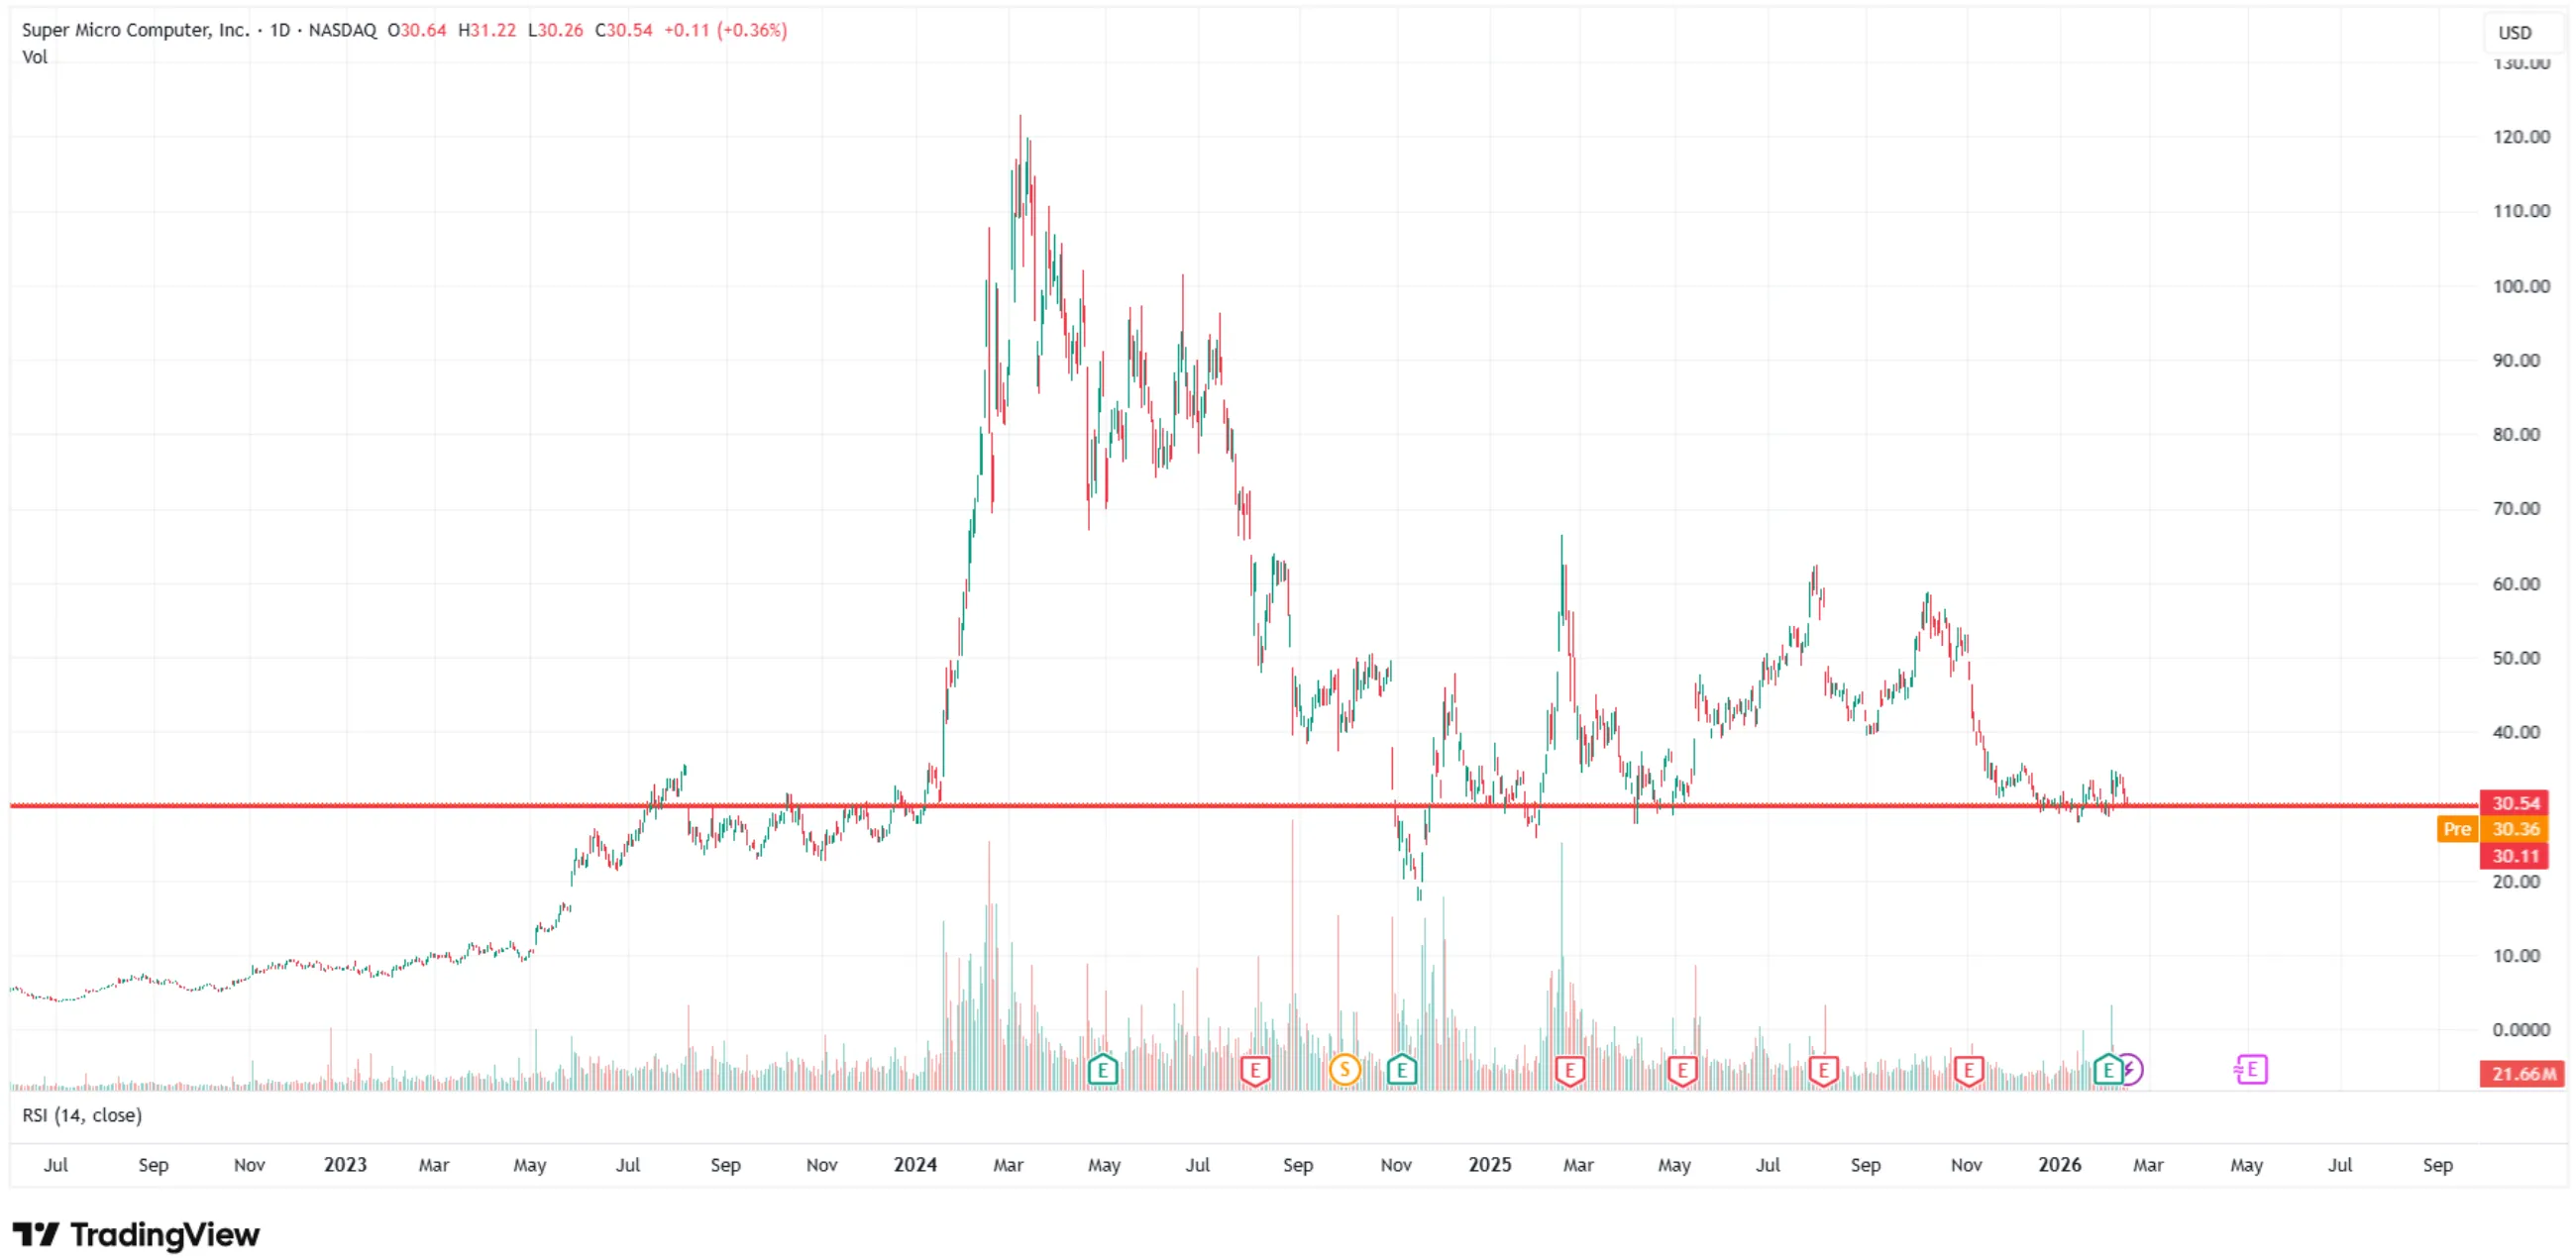
Both charts point to the same junction: SMCI is sitting at multi-year structural support after a purge that destroyed 75% of its market capitalisation.
Long-Term View - Multi-Year Demand Zone (TradingView)SMCI fell 75%+ from its $120+ peak in March 2024. The stock has returned to the 2022–2023 breakout base - the precise demand zone that launched the entire AI mania rally. A strong horizontal support sits at $30–$35, validated across multiple years of price action. RSI is recovering from deeply oversold territory. This is the level where long-term institutional accumulators historically entered before the 10× move. The magnitude of the prior advance means even a partial recovery to half-peak levels implies a 100%+ return from current prices.
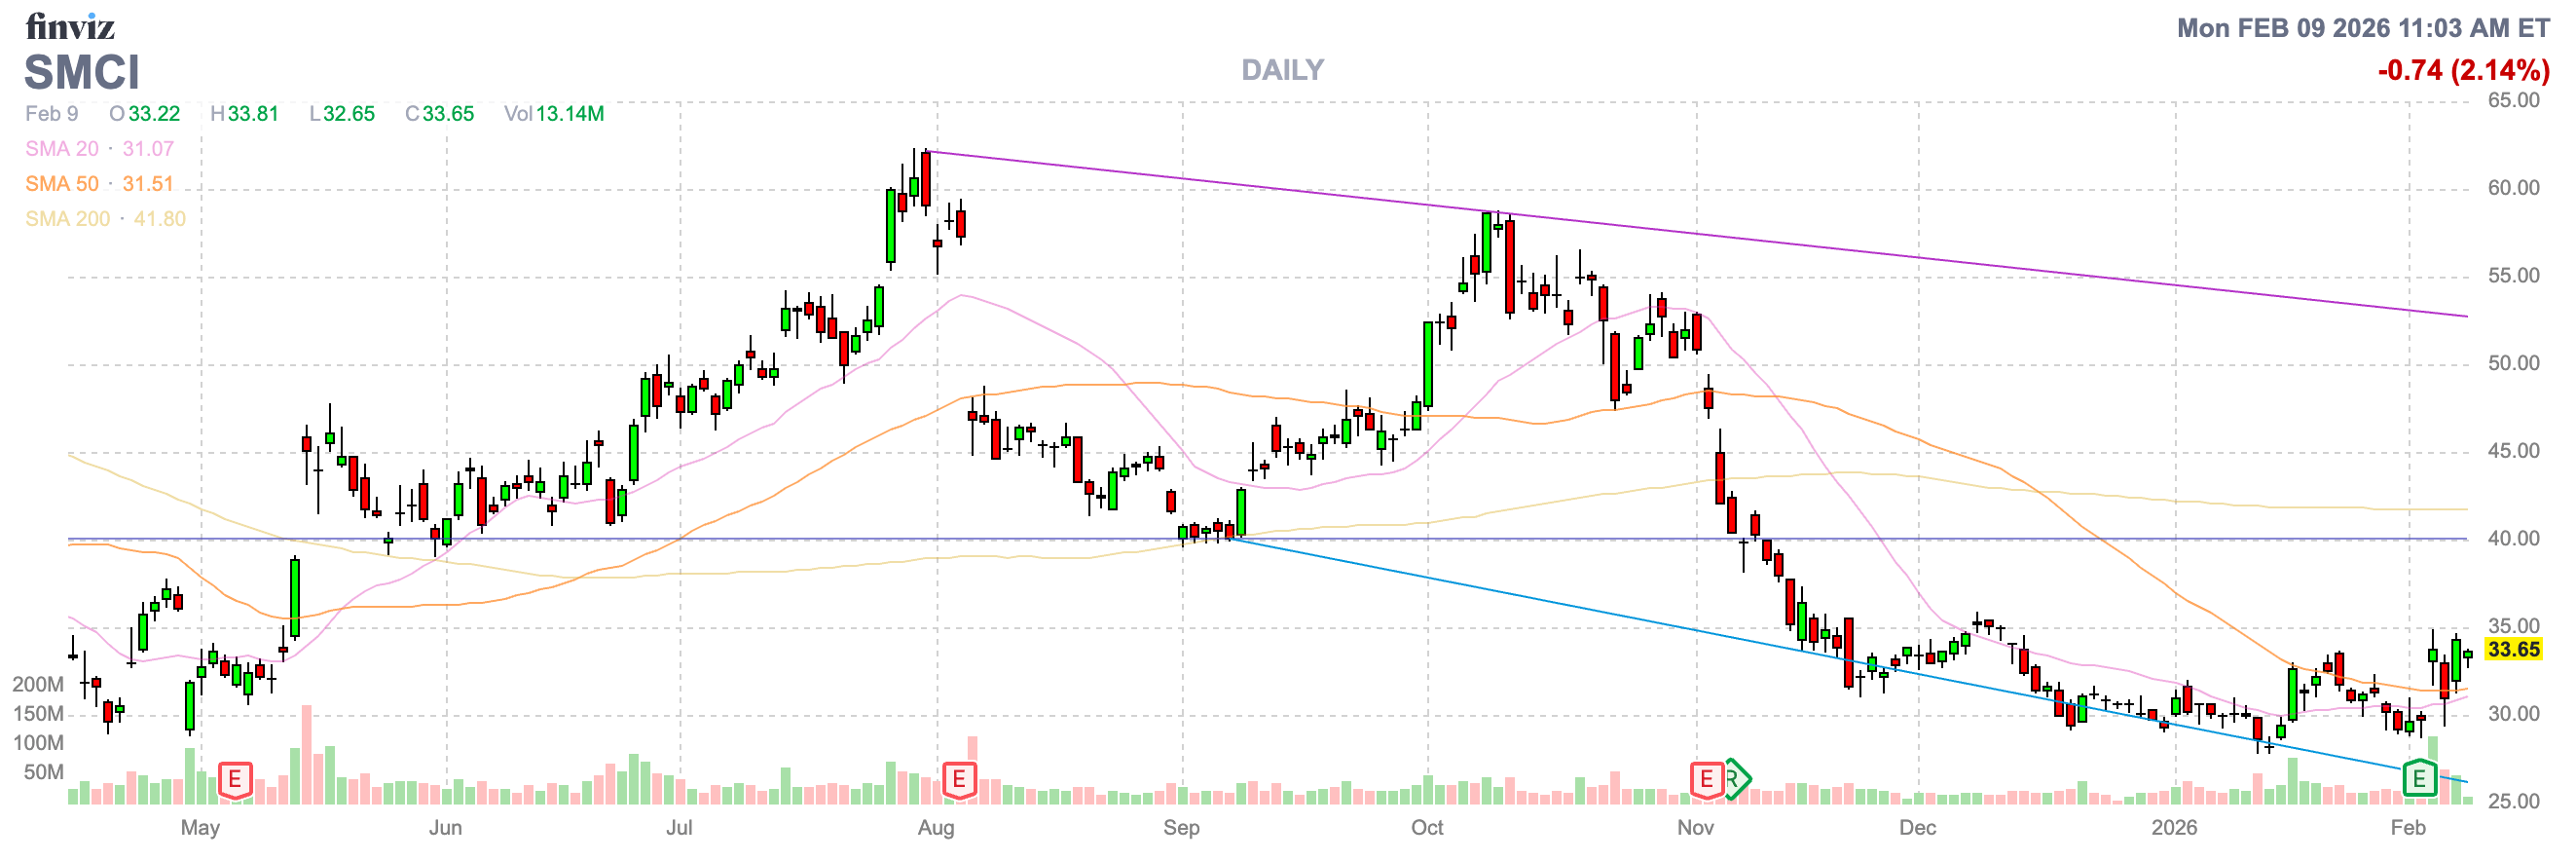
Short-Term View - Trendline Breakout + Base Formation (Finviz Daily)A 7-month descending resistance line from the July 2025 high (~$62) has been cleanly broken on post-earnings volume (Feb 3, 2026). An ascending support trendline from the December 2025 lows is intact. Price has reclaimed both the 20-day SMA ($31.07) and 50-day SMA ($31.51). The 200-day SMA at $41.80 is the first major overhead target - and aligns closely with our base-case $45 objective. Entry at $29–$32 sits at the intersection of both trendlines: the lowest-risk tactical entry since the 2024 peak.
Bear vs. Bull
The Prosecution vs. The Defense
We take the bear case seriously. Here is how we weigh it against our analysis.
The Prosecution - Bear Case
The Defense - Our Response
Count I - Structural Margin Impairment
Gross margins at 6.4% - an all-time low, falling 550bps year-over-year. Gross profit grew only 19% on 123% revenue growth. SMCI is assembling $12.7B of hardware while capturing less than 7 cents on the dollar. Nvidia takes the premium at the top; hyperscalers extract it at the bottom. This is not a cycle - it is structural gravity.
Platform Transition, Not Structural Gravity
Three temporary factors converged in Q2: new GB300 platform expedite freight costs, a single hyperscale client at 63% concentration driving price concessions, and component shortages during extraordinary demand. CEO confirmed Q3 already guides +30bps sequential improvement. DCBBS at 20%+ GM is the structural answer. This is a transition trough - management's own words - not a terminal condition.
Count II - 63% Customer Concentration
A single unnamed hyperscale client - potentially building capacity for OpenAI or similar - drove 63% of Q2 revenue. If this entity reduces orders, delays deployment, or encounters its own financing problems, SMCI's revenue could collapse by 40–50% in one quarter. No business should depend on one customer for its survival.
Acknowledged, Actively Addressed
Customer concentration is our top-ranked risk - we hold it explicitly. However: management committed to diversification on the earnings call. Enterprise channel delivered $2B in Q2 (+42% YoY). Federal Business Unit is newly established. DCBBS attracts mid-sized and sovereign AI customers globally who want a one-stop shop. The 63% will decline; the rate of decline is the key watch variable.
Count III - No Durable Moat
SMCI assembles servers. Dell, HPE, Wistron, and Asian ODMs assemble servers too. When NVIDIA standardises reference architectures, SMCI's customisation advantage narrows. Commodity hardware manufacturers do not earn premium valuations - they earn the valuation of commodity manufacturers.
32-Year Engineering Depth, Misunderstood
SMCI pioneered Direct Liquid Cooling integration one full generation before NVIDIA made it reference architecture. CEO guided to continue bringing total solutions to market 3–6 months ahead of peers. Named preferred Vera Rubin NVL72 integration partner. DCBBS deployed at the world's first GigaWatt data centre. Six thousand racks per month capacity by year-end FY26. This is real, proprietary engineering depth - not commodity assembly.
Count IV - Q4 Guidance Implies Reversal
The $40B FY26 guidance implies a 20%+ QoQ revenue decline in Q4. Two years of guidance misses and governance scandal have created near-zero management credibility. The market will not pay a premium on projections from an organisation that has repeatedly failed to deliver them.
"$40B Is Conservative" - CEO's Own Words
The Q4 implied softness in the $40B floor reflects conservatism on component availability, not demand. CEO Liang described the guidance as "relatively conservative" and projected the business would "continue to grow." Hyperscaler CapEx - META at $135B, Amazon at $200B, Alphabet at $175–185B - is the most concrete demand backdrop in SMCI's history. The Q2 beat came against lowered expectations; that is exactly how credibility gets rebuilt.
Valuation Context
Peer Scorecard - Where SMCI Stands
SMCI vs. the key comparables in AI data centre infrastructure
Company
Rev. Growth
Gross Margin
Fwd P/E (FY27)
Fwd P/S
DCBBS Analog?
Our View
Super Micro (SMCI)
+123% YoY
6.4%
11.6×
~0.5×
Yes - SMCI 4.0 emerging
LONG
Dell Technologies (DELL)
~12% YoY
~22%
9.3×
~0.4×
Partial
NEUTRAL
Vertiv Holdings (VRT)
~20% YoY
~35%
29.6×
~3.5×
Full analog - DCBBS pure-play
EXPENSIVE
HP Enterprise (HPE)
~3% YoY
~32%
~8.5×
~0.4×
Partial
NEUTRAL
Key insight: SMCI's revenue growth is 10× Dell's at one-third of Vertiv's P/E multiple. If DCBBS achieves even 50% of Vertiv's margin profile over the next 12 months, a re-rate to 15–18× forward P/E is entirely defensible - 30–55% above the current share price without any EPS estimate upgrades.
Price Targets
EPS × P/E Scenario Matrix
Entry assumed at $32 (midpoint of range). Based on FY2027 consensus EPS estimates. 12-month investment horizon.
🐻 Bear Case
$20
–37.5% from entry
FY27 EPS$2.00
P/E Applied10.0×
Implied Price$20
Thesis Invalidation Level$22 (–$10)
Margin recovery stalls. Major customer reduces orders. DCBBS ramp significantly delayed. Market re-rates as permanent commodity assembler. Our hard stop at $22 limits realised loss to ~$10 from entry midpoint. Note: the bear scenario's implied price of $20 would never be experienced by a disciplined investor following this framework - the hard stop at $22 exits the position before the bear case fully resolves. The $20 figure represents where the fundamentals would price the stock in the bear scenario, not where the position is held to. In practice: a position entered at $32 midpoint with a $22 stop limits the realised bear-case loss to approximately $10 (31%) - the stop protects against the full bear case deterioration to $20.
📊 Base Case
$45
+40.6% from entry
FY27 EPS$3.00
P/E Applied15.0×
Implied Price$45
Also = 200-day SMA~$42
Margins recover to ~8–9% blended. DCBBS grows toward double-digit profit contribution. Market begins re-rating away from commodity multiple. Execution consistent with Q2 beat. Goldman Sachs price target range: $40–$59.
🚀 Bull Case
$55
+71.9% from entry
FY27 EPS$3.20
P/E Applied17.0×
Implied Price$54.40
Historical Fwd P/S1.1× → $44B
Vera Rubin GPU cycle drives strong H2 2026. DCBBS hits double-digit profit contribution ahead of schedule. Customer diversification removes concentration discount. Narrative resets to "SMCI 4.0 = the Vertiv of AI infrastructure."
Risk/Reward: Bear realised loss of ~$10 (stop at $22) vs. base gain of ~$13 and bull gain of ~$23. At the entry midpoint, the favourable scenarios carry approximately 2–3× more dollar upside than our worst-case downside assuming disciplined stop usage. This is the asymmetry that justifies the position.
Catalyst Calendar
Catalyst Checklist
Events capable of materially re-rating SMCI over the 9–12 month horizon, with our probability assessments
Q1 2026
Q3 FY26 Earnings - First Margin Recovery Print (April 2026)Management has guided explicitly for +30bps sequential gross margin improvement. A confirmed recovery resets market credibility on guidance. Two consecutive beats would accelerate re-rating materially. This is the single most important near-term catalyst - failure here re-tests $22 support.
High - 80%
H2 2026
NVIDIA Vera Rubin GPU Platform LaunchSMCI announced readiness to ship Vera Rubin NVL72 rack-scale systems delivering 3.6 exaflops per rack. As NVIDIA's preferred integration partner, SMCI gets first access to the highest-demand product in data centre infrastructure. Vera Rubin is the same structural catalyst that drove the GB200 cycle - which powered SMCI's prior 10× move.
High - 75%
CY 2026
DCBBS Reaches Double-Digit Profit ContributionManagement guided this milestone explicitly. At 20%+ GM versus 6.4% core, every percentage point of DCBBS profit share meaningfully expands blended margins. This is the pivotal catalyst for P/E re-rating from "commodity" to "platform" - the Vertiv comparison becomes credible at this threshold.
Medium - 65%
Ongoing
Customer Concentration Declining Meaningfully Below 63%Each quarterly step down in single-customer concentration removes a specific risk discount from the share price. Enterprise channel +42% YoY, Federal Business Unit launched, sovereign AI demand globally - the diversification trajectory is confirmed. The question is pace.
Medium - 60%
H1 2026
Gross Margin Above 8% - The Psychological TriggerBelow 8%, the market's "commodity assembler" narrative holds. Above 8% with DCBBS proof points showing in reported results, the platform comparison becomes investable for a broader institutional audience. This is the level at which consensus upgrades would likely follow.
Medium - 55%
2026
Hyperscaler CapEx Sustaining $600B+ TrajectoryMETA ($135B), Amazon ($200B), Alphabet ($175–185B) all guiding to record 2026 CapEx. Total hyperscaler spend projected above $600B by Mitsubishi UFJ. Any significant reduction represents a systemic risk to the entire thesis. Currently tracking above initial projections.
High - 78%
Risk Assessment
Risk Register
Ranked by severity to the investment thesis. Position sizing is calibrated accordingly.
⚠️Customer Concentration - Principal RiskCritical
One unnamed hyperscale customer drove 63% of Q2 FY26 revenue - roughly $8B from a single relationship. If this entity reduces or cancels orders for any reason (own financial pressure, order satisfaction, competitive shift, or regulatory intervention on AI infrastructure build-out), SMCI's revenue could decline 40–50% in a single quarter. There is no precedent for this level of concentration in a business of this scale being healthy long-term.
Mitigation: Hard stop-loss at $22 limits capital at risk. Monitor quarterly customer concentration disclosure. Watch for enterprise and federal channel acceleration as leading indicators of diversification progress.
📉DCBBS Ramp Slower Than GuidedHigh
Our thesis depends on DCBBS reaching double-digit profit contribution by end of CY2026. If competitive pressure from Dell, HPE, or ODMs intensifies in the full-stack data centre market, DCBBS adoption may lag. Our margin recovery roadmap breaks if the product line does not grow as projected - leaving SMCI with 6.4% margins and no credible re-rating catalyst.
Mitigation: Monitor DCBBS revenue and profit disclosure each quarter. If DCBBS profit contribution stalls below 6% for two consecutive quarters, reassess position size ahead of the 12-month horizon close.
🏭Competitive IntensificationElevated
Dell Technologies is scaling its AI infrastructure business aggressively and competing directly for hyperscale rack contracts. HPE, Lenovo, and Taiwan ODMs provide lower-cost assembly alternatives. If SMCI's engineering time-to-market advantage narrows, pricing pressure persists beyond our anticipated trough - and the path to margin recovery elongates materially.
Mitigation: SMCI's 3–6 month platform advantage on new GPU cycles (confirmed by CEO for Vera Rubin) provides near-term competitive insulation. Watch for market share data in quarterly revenue splits between SMCI, Dell, and HPE in AI infrastructure.
🌐AI CapEx Cycle ReversalElevated
SMCI's revenue trajectory is entirely dependent on hyperscaler data centre investment continuing at or above current pace. A DeepSeek-style efficiency breakthrough that reduces compute requirements, a regulatory intervention on AI infrastructure, a meaningful economic recession, or a credible AI revenue disappointment from a major hyperscaler could all trigger rapid CapEx rationalisation. The $600B figure is a projection, not a guarantee.
Mitigation: Sovereign AI programmes (Middle East, Asia), US federal AI initiatives, and enterprise AI adoption provide demand diversification beyond private hyperscalers. Monitor quarterly CapEx guidance from META, AMZN, and Alphabet as leading indicators.
The following scenarios reflect the author’s personal analysis and are not investment recommendations. See our full disclaimer.
Position Summary · NASDAQ: SMCI · Initiated February 6, 2026
Scenario Entry Range
$29 – $32
Thesis Invalidation (Hard)
$22.00
Target Zone
$45 – $55
Max Downside at Stop
~31%
Base Case Upside
~40%
Risk / Reward
≥1 : 2.5
Investment Horizon
9–12 Months
Conviction Level
HIGH
Forward P/S at Entry
~0.5×
SMCI is not a comfortable position. Customer concentration is real, margin uncertainty is real, and the governance history has cost shareholders dearly before. We are long nonetheless - because we believe the market has drawn a permanent conclusion from what is a temporary condition. The AI infrastructure build-out is not slowing; it is accelerating, with $600B+ in hyperscaler CapEx committed for 2026 alone. SMCI sits at the intersection of that spending, a multi-year technical demand zone, and the beginning of a platform evolution - SMCI 4.0 - that changes its margin profile entirely. The stock trades at less than half its annual revenue guidance. At $32, with a hard stop at $22 and a base case of $45, the risk-adjusted setup is one of the most asymmetric we see in the AI hardware universe today. We are comfortable being early. We are not comfortable being wrong without a stop.
Important Disclaimer: This market tip is provided for informational and educational purposes only. It does not constitute financial advice, a solicitation, or a recommendation to buy or sell any security. All data sourced from Supermicro Q2 FY2026 earnings call (February 3, 2026), company investor presentations, and third-party research. Past performance is not indicative of future results. All investments carry risk, including the possible loss of principal. Please conduct your own due diligence and consult a qualified financial advisor before making investment decisions. PolyMarkets Investment Strategies does not hold or trade positions in covered securities unless explicitly disclosed.