Here's something I've noticed after years of watching people invest: the ones who build serious wealth almost never have some genius stock-picking secret. They're not glued to CNBC. They didn't catch the bottom in March 2020 or sell before the dot-com crash. What they did was far less exciting - they understood a handful of principles, stuck with them when everything felt like it was falling apart, and let time do the heavy lifting.
That's what this piece is about. Not tips, not hot takes, not the flavor-of-the-month strategy. Ten principles that have survived every market crash, every bubble, every "this time is different" narrative of the past century. Some of them are counterintuitive. A few will feel almost insultingly simple. But the data behind them is relentless - and the gap between investors who internalize these ideas and those who don't is staggering.
Principle 1 - The Real Risk Is Not Investing
Ask most people what risk means in investing and they'll say "losing money." But there's a risk that's arguably worse because it's invisible: the slow, guaranteed destruction of your purchasing power when you leave long-term savings in cash.
Inflation doesn't send you a notification. It doesn't show up as a red number on your bank statement. At 3% annually - which is pretty modest historically - your cash loses about half its real purchasing power in 25 years. Half. Gone. Not because anything dramatic happened, but because you did nothing. So the real question isn't whether you can afford to invest. It's whether you can afford to sit there and watch inflation eat your savings for breakfast every single year.
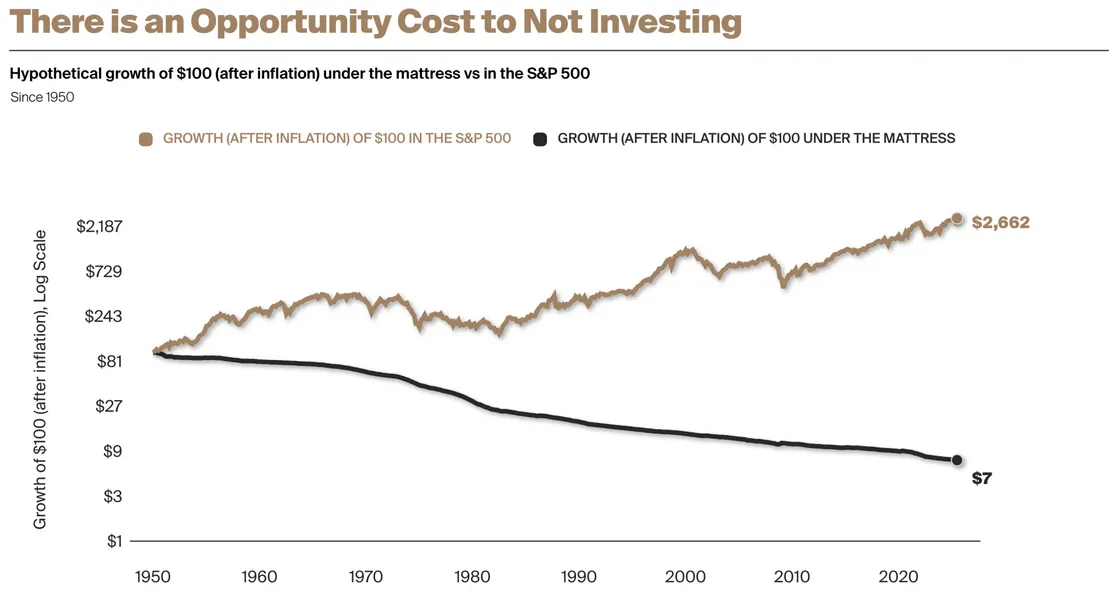
Look at the numbers and try not to wince. $100 invested in the S&P 500 in 1950 is worth $2,662 today in real, inflation-adjusted dollars. That same $100 left in cash? Seven dollars. Not seven hundred. Seven. A 93% destruction of real value over seven decades - and the person holding that cash felt "safe" the entire time. That's what gets me about this. The feeling of safety and the reality of safety are completely different things when it comes to money sitting idle.
Cash Still Has a Role
I'm not saying drain your savings account tomorrow. Emergency funds, near-term spending money, that home down payment you need in two years - absolutely keep those liquid. But capital you won't touch for five-plus years? Every day it sits in a savings account earning 0.5% while inflation runs at 3%, you're choosing the one investment strategy with a guaranteed negative real return. People think they're avoiding risk. They're actually guaranteeing a loss - it just happens slowly enough that it doesn't feel like one.
Principle 2 - Leverage the Power of Compound Returns
Einstein supposedly called compound interest the eighth wonder of the world. Whether he actually said that is debatable (the internet attributes everything to Einstein). But the math? The math is not debatable at all.
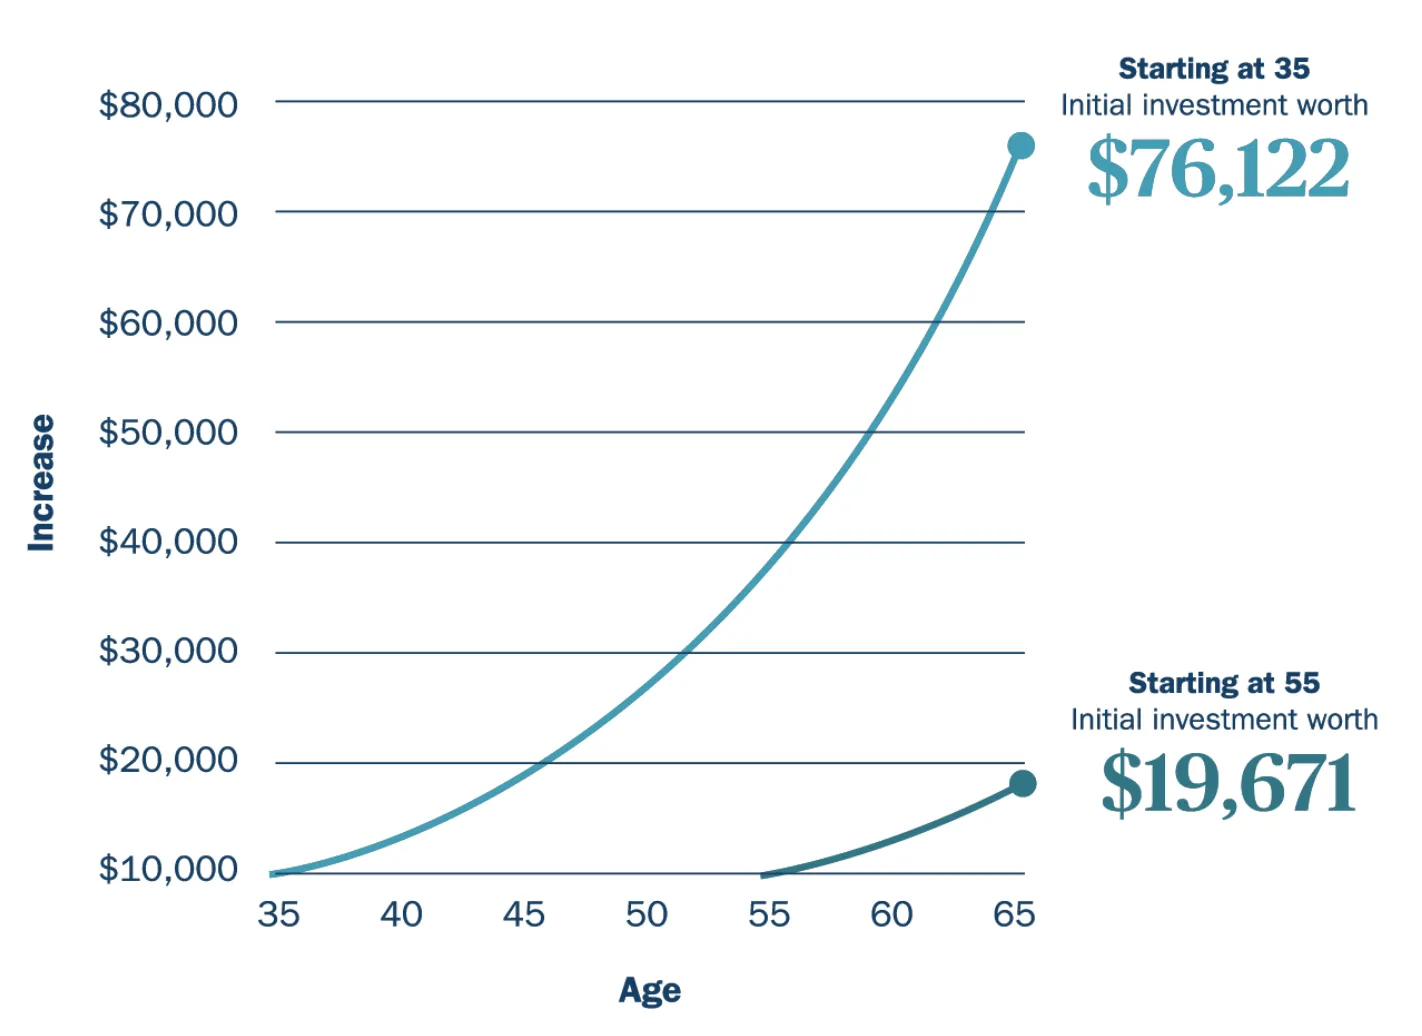
Compounding is deceptively simple. Your returns generate returns. Those returns generate their own returns. And then it just... accelerates. The thing most people miss is which variable matters most in the equation. It's not the return rate. It's not how much you start with. It is time. And here's the cruel part - time is the one input you cannot buy more of later. A 22-year-old investing $200 a month at average market returns will almost certainly retire wealthier than a 45-year-old investing $800 a month. That feels unfair. But the math doesn't care about fairness.
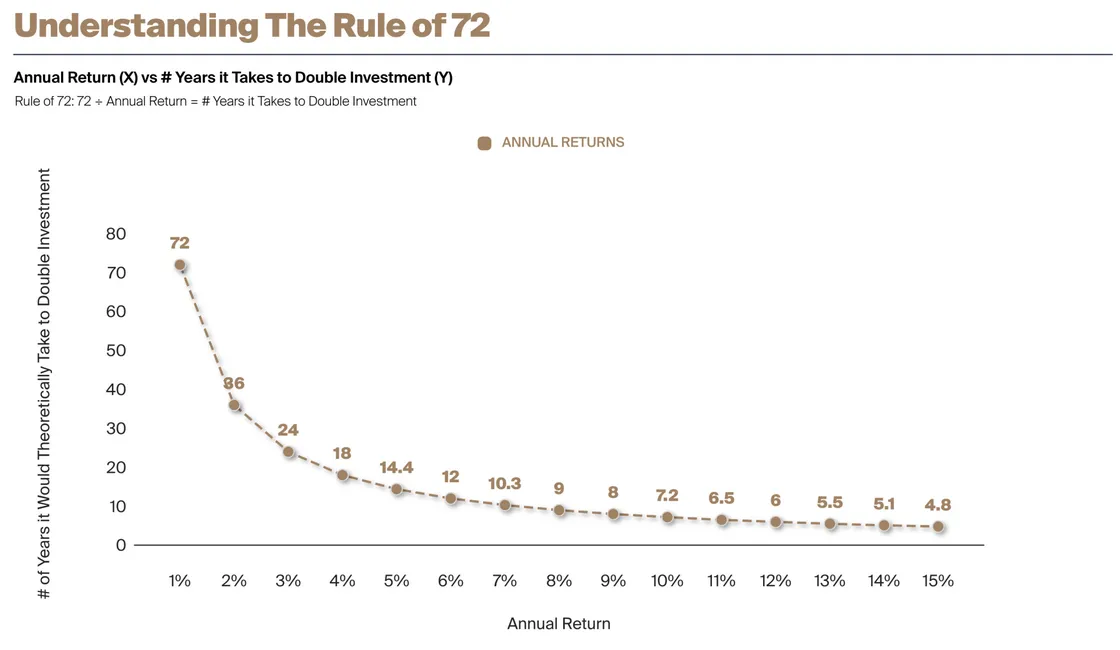
The Rule of 72 is the quickest mental math trick in finance. Divide 72 by your annual return and you get roughly how many years it takes to double your money. Earning 6%? Doubles in 12 years. Getting 10%? Just over 7 years. At 12%, six years flat. Now run that forward three or four doubling periods and you start to see why a seemingly small difference - say, 7% versus 10% - produces wildly different outcomes over a 30-year career. It's also why I get genuinely irritated when people shrug off a 1% management fee. That 1% doesn't sound like much until you realize it's eating one of your doubling periods over a lifetime of investing.
| Initial Investment | Annual Return | 10 Years | 20 Years | 30 Years |
|---|---|---|---|---|
| $10,000 | 5% | $16,289 | $26,533 | $43,219 |
| $10,000 | 7% | $19,672 | $38,697 | $76,123 |
| $10,000 | 10% | $25,937 | $67,275 | $174,494 |
| $10,000 | 12% | $31,058 | $96,463 | $299,599 |
Principle 3 - Time in the Market, Not Timing the Market
Everyone thinks they can time the market. Get out before the crash, get back in at the bottom. It sounds so logical. And it fails almost everyone who tries it - including the professionals with Bloomberg terminals and PhD quant teams.
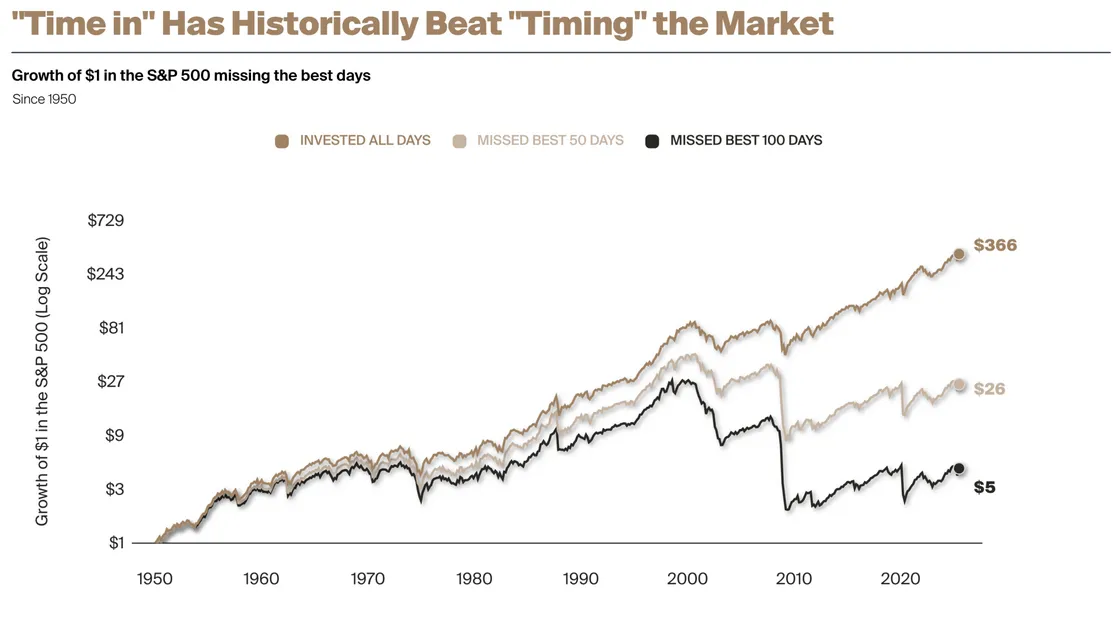
One dollar, fully invested from 1950 to today, grew to $366. Miss just the 50 best trading days out of roughly 18,000 and you end up with $26. Miss the 100 best? Five dollars. Five. And here's the kicker that makes market timing basically impossible: the best days in the market cluster right next to the worst days. They show up during panics, during crashes, during the exact moments when your gut is screaming to sell everything and hide in cash. March 2020 had some of the worst single-day drops in history. It also had some of the best single-day rallies. You cannot capture one while avoiding the other. The market doesn't send you a calendar invite for the good days.
The Performance Gap Is Real and Measurable
DALBAR has been tracking this for decades and the numbers are frankly embarrassing. Over a 20-year stretch where the S&P 500 returned 9.9% annually, the average equity investor earned 2.5%. Read that again. The market gave 9.9%. Humans, left to their own timing instincts, captured barely a quarter of it. The entire 7.4-point gap came from one thing: badly timed entries and exits. Not bad fund selection. Not fees. Pure behavior - buying after rallies felt safe, selling after drops felt prudent. The opposite of what works, executed with perfect consistency.
| Holding Period | Activity Type | S&P 500 Historical Win Rate |
|---|---|---|
| 1 day | Speculation | ~53% |
| 1 year | Short-term trading | ~73% |
| 5 years | Investing | ~88% |
| 10+ years | Long-term compounding | ~95% |
| 20+ years | Wealth building | ~99%+ |
Principle 4 - Don't Chase the Crowd
If your Uber driver is telling you about a stock, you're late. If it's on the front page of CNN, you're very late. If your aunt who doesn't own a brokerage account is texting you about it, you should probably be selling, not buying.
I've watched this cycle play out so many times it almost feels scripted. An asset starts doing well. Smart money gets in early and profits. Then the media picks it up. Then Twitter. Then Reddit. Then your coworker who's never mentioned investing before suddenly has "strong conviction" on something. Retail money floods in. Prices detach from any reasonable valuation. And then? Reversal. Panic. The same people who bought at the top sell at the bottom, locking in losses, and swear off investing forever - until the next cycle starts and they do it all over again. Stanford researchers found something wild: even when investors know an asset is overpriced, they keep buying because the social pain of missing out while their friends profit exceeds the financial pain of the eventual loss. We're not rational creatures. Not even close.
This has played out with Dutch tulips, with dot-com stocks (Pets.com, anyone?), with Miami condos in 2007, with Bitcoin at $69,000, with meme stocks. The common thread isn't stupidity - plenty of smart people got caught in every one of these. It's that humans are wired to interpret crowd behavior as a safety signal. If everyone is buying, it must be safe, right? In almost every other area of life, that instinct works. In investing, by the time the crowd arrives, the easy money is already gone.
Contrarianism Is Not the Answer Either
And before someone reads this and decides to just bet against the crowd on everything - no. That's equally dumb. Sometimes the crowd is right. Apple at $150 in 2023 wasn't a bubble just because everyone liked it. Real contrarian investing means doing your own homework, knowing what something is actually worth, and having the stomach to be wrong for months or years before your thesis plays out. The better approach: base decisions on valuations and fundamentals, not on what your social feed is excited about. When everybody agrees something is a sure thing and the valuation reflects perfection, the risk is at its absolute peak regardless of how good the story sounds.
Principle 5 - Take the Right Amount of Risk
The goal isn't to eliminate risk. You can't. The goal is to take exactly enough risk to meet your objectives without taking so much that you'll panic and blow up your plan when markets drop 35%.
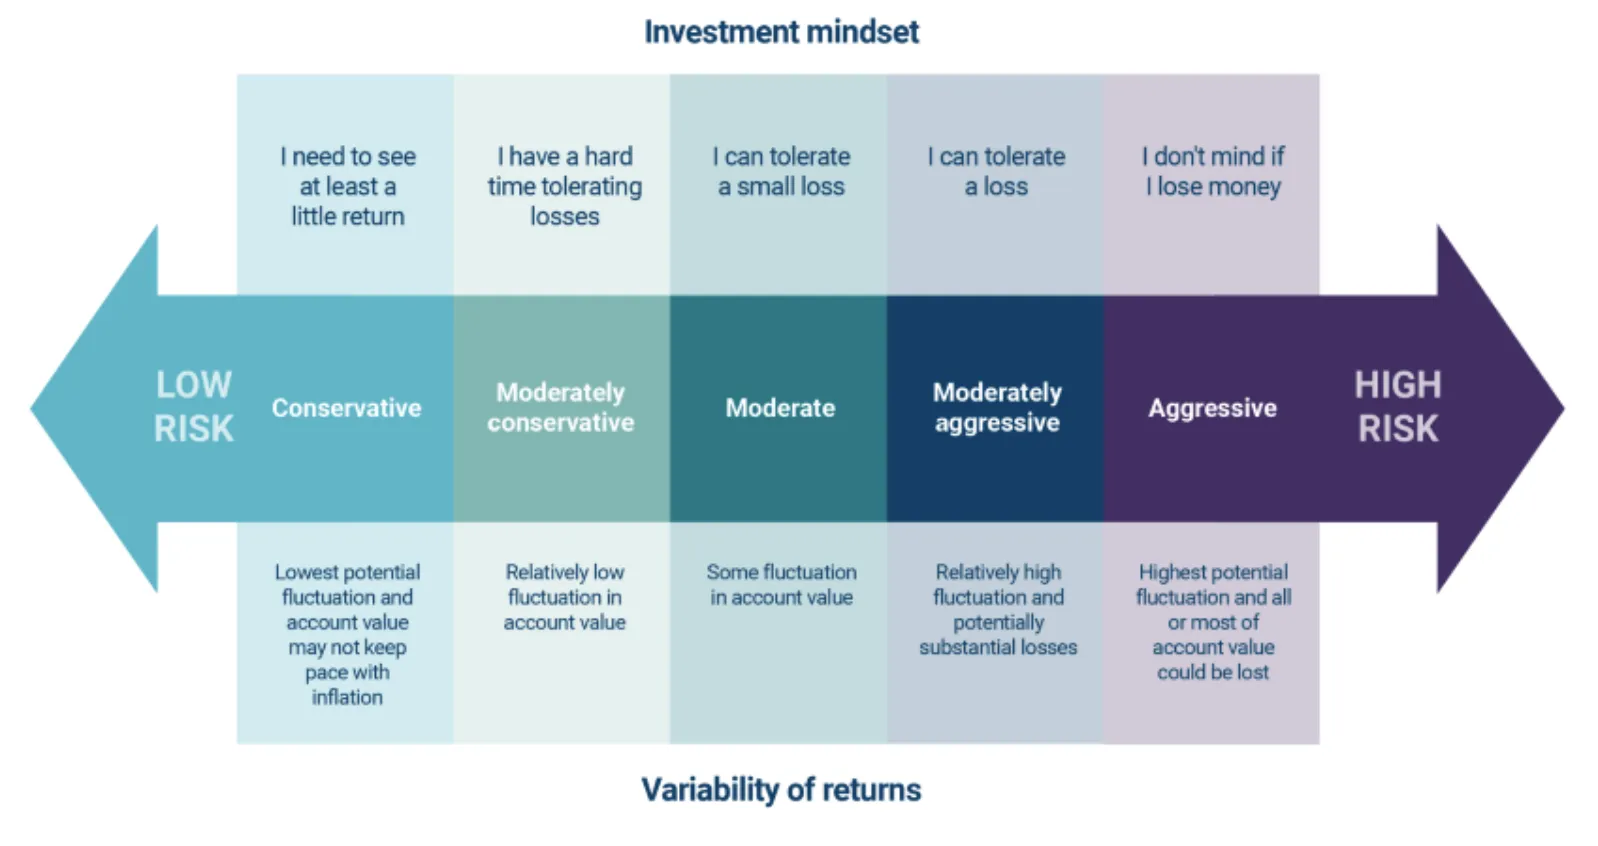
Too much risk and you end up with a portfolio that looks amazing in bull markets but destroys you psychologically when things go south. You panic-sell at the bottom. Too little risk and inflation quietly eats your savings while you feel safe. Both paths lead to the same place: falling short of your goals. The sweet spot? A portfolio you can hold through a 30-40% drawdown without doing anything stupid. That's your real risk tolerance - not what you say on a questionnaire, but what you actually do when your account is down six figures.
Here's something behavioral researchers figured out that I think is critically important: the risk tolerance you express in calm markets is basically fiction. Everyone is aggressive in a bull market. Everyone says they'll hold through a crash. Then the crash actually arrives and the same people who said "I have a high risk tolerance" are frantically selling at the worst possible moment. Build your portfolio for the person you become at 2 AM when futures are down 800 points and CNBC has the word "CRISIS" on screen in giant red letters. That's the real you.
| Risk Factor | Supports Higher Risk | Supports Lower Risk |
|---|---|---|
| Time Horizon | 20+ years to retirement | Under 5 years to major withdrawals |
| Income Stability | Secure, growing income | Variable or uncertain income |
| Liquidity Needs | Low - money is truly long-term | High - may need unexpected access |
| Emotional Capacity | Can watch 30% drawdown calmly | Small declines cause significant stress |
| Net Worth Outside Portfolio | Substantial safety cushion exists | This portfolio is the primary safety net |
Principle 6 - Use Dollar-Cost Averaging as Your Default
DCA is boring. It's mechanical. It requires zero skill and zero market insight. And it beats the vast majority of people who try to be clever about when they invest. That combination of boring and effective is exactly why most investors should use it as their default.
The concept is dead simple: invest the same dollar amount on a regular schedule - every month, every two weeks, every paycheck. Don't look at the market first. Don't check the headlines. Just buy. When prices are low, your fixed amount buys more shares. When prices are high, it buys fewer. Over time, this mechanically pulls your average cost below the average price during your investment period. You're not timing anything. You're letting arithmetic do work that most human judgment makes worse, not better.
| Month | Invested | Share Price | Shares Purchased | Running Avg Cost |
|---|---|---|---|---|
| January | $500 | $50.00 | 10.00 | $50.00 |
| February (dip) | $500 | $38.00 | 13.16 | $44.78 |
| March (low) | $500 | $30.00 | 16.67 | $39.68 |
| April (recovery) | $500 | $44.00 | 11.36 | $40.29 |
| May (new high) | $500 | $55.00 | 9.09 | $41.61 |
Average share price over five months: $43.40. Your actual average cost through DCA: $41.61. You ended up buying the heaviest position during the dip - the exact right move - without making a single market call. No analysis required. No gut feelings consulted. Just the math doing its thing.
Automate It and Forget It
Set up automatic transfers the day after your paycheck hits. Don't give yourself the chance to hesitate, check the market, or decide that "this month feels wrong." The entire value of DCA is that it removes you from the equation - and frankly, removing you from the equation is the single highest-value investment strategy most people will ever implement. That sounds harsh. But after watching DALBAR data for two decades showing that investor behavior destroys 7+ points of annual return, I'm comfortable saying it. The automation is the strategy.
Principle 7 - Diversify Broadly and Allocate Strategically
People confuse diversification with asset allocation constantly. They're related but different, and getting the distinction right matters more than most investors realize.
Diversification is straightforward - don't put all your eggs in one basket. Own different types of things: U.S. stocks, international stocks, bonds, real estate, maybe some commodities. When tech crashes (2000-2002), your bonds and international holdings provide a cushion. When U.S. markets lag (the entire 2000-2009 decade, basically), international and emerging market exposure picks up the slack. No single bad bet can sink the whole ship.
Asset allocation is the harder question: how much of each? And the answer depends on things that are specific to you. A 28-year-old software engineer with a stable income and no kids should hold a very different mix than a 58-year-old teacher five years from retirement. Stocks do well in expansions. Bonds hold up in recessions. Commodities shine during inflation. Cash is king when rates are high. The right blend reflects your situation right now - and it should change as your life changes.
| Asset Class | Primary Role | Performs Best When | Risk Level |
|---|---|---|---|
| Domestic Equities | Growth engine | Economic expansion, low inflation | High |
| International Equities | Diversification & growth | USD weakness, foreign growth cycles | High |
| Bonds (Fixed Income) | Stability & income | Recessions, falling interest rates | Low–Medium |
| Real Estate / REITs | Inflation hedge & income | Moderate inflation, stable rates | Medium |
| Commodities | Inflation & crisis hedge | High inflation, supply disruptions | High |
| Cash / Short-Term Bonds | Liquidity & optionality | Recessions, high-rate environments | Very Low |
Sir John Templeton
"Diversify. In stocks and bonds, as in much else, there is safety in numbers." Here's the trade-off you need to accept: a diversified portfolio will never be the top performer in any given year. There will always be some concentrated bet that did better. But it also won't be the worst. And over the long run, consistently avoiding catastrophic losses is worth enormously more than occasionally hitting a home run. The person who returns 8% every year for 30 years ends up far wealthier than the person who makes 25% one year, loses 40% the next, and keeps swinging between hero and zero.
Principle 8 - Volatility Is Normal, Not an Emergency
Volatility is not a bug. It's a feature. And the sooner you internalize that distinction, the sooner you stop making the expensive mistake of treating every market dip as an emergency that demands action.
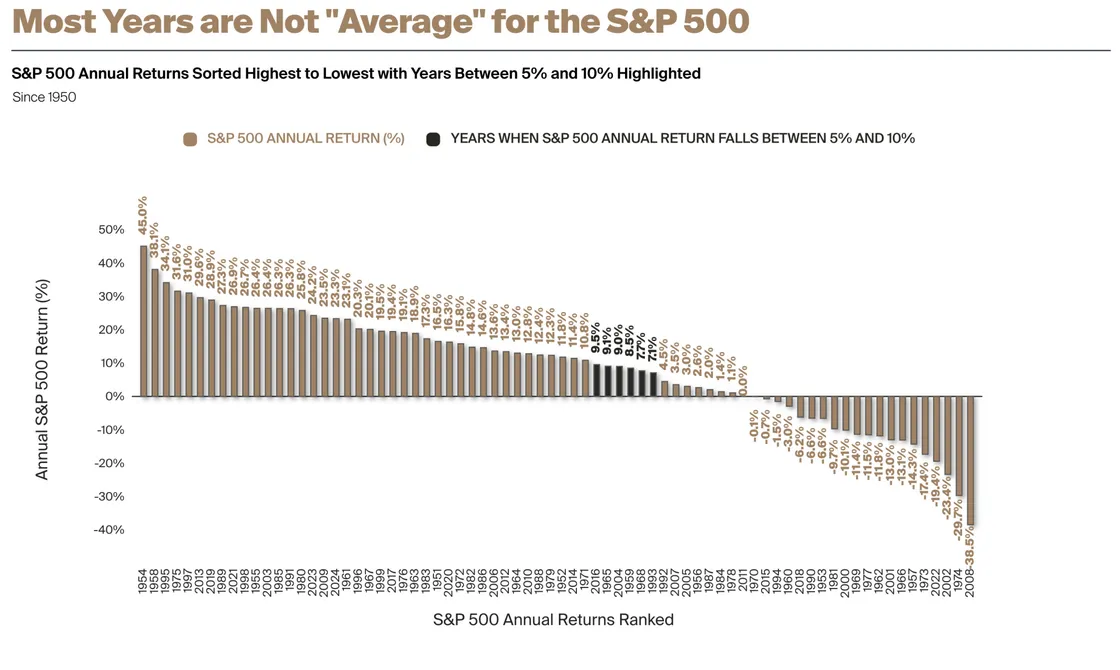
The S&P 500 averages about 10% per year. Sounds smooth, right? Steady 10% growth, year after year? Not remotely. Look at the actual distribution and you'll notice something surprising: years that actually deliver around 10% are the minority. Most years, the market is up 20% or down 15% or swinging wildly in both directions. The "average" is a mathematical artifact that almost never shows up in any individual year. It's like saying the average American family has 2.3 kids. Nobody has 2.3 kids. Expecting smooth returns from an inherently jagged asset is a setup for disappointment and bad decisions.
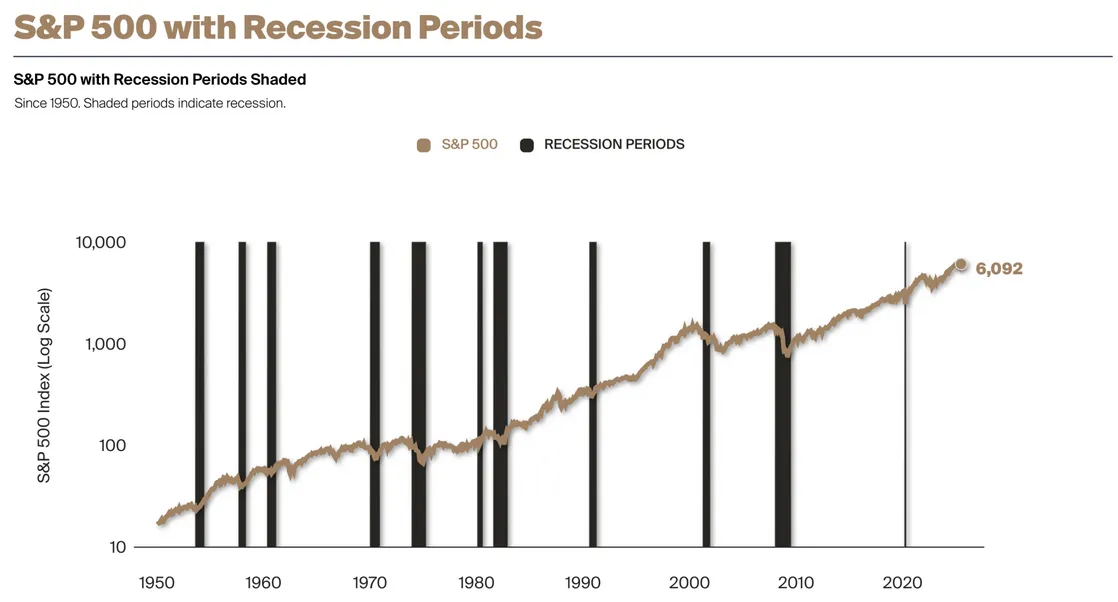
Now look at the recession chart. Every single shaded bar is a period where the economy contracted, markets tanked, headlines were apocalyptic, and perfectly rational people questioned whether recovery was possible. The 1973 oil crisis. The 2001 tech wreck. The 2008 financial meltdown. COVID in 2020. And in every single case - every single one - the market recovered and eventually hit new all-time highs. The investor who just sat there, doing nothing, through all of it? Ended up at 6,092. The investor who sold during any one of those recessions and waited until things "felt safe" to get back in? Permanently poorer. Not temporarily. Permanently.
Volatility Is the Price of Admission
Why do stocks return more than bonds or cash over the long run? Because they're volatile. That's it. That's the entire mechanism. The excess return is compensation for enduring uncertainty - for sitting through 30% drawdowns without flinching. Most people can't do it. And every time they sell in a panic, they're essentially transferring the volatility premium to the investors who stayed put. If you can tolerate the ride, you collect that premium decade after decade. If you can't, you end up paying it to someone else. There's no third option.
Principle 9 - Review and Rebalance Regularly
Your portfolio drifts whether you pay attention or not. Winners grow and become a bigger slice. Losers shrink. And over time, what started as a balanced allocation quietly becomes a concentrated bet on whatever's been hot lately.
Here's a concrete example. You set up a classic 60/40 stock-bond portfolio in 2015. Stocks rip higher for five years. You do nothing - no trades, no changes. By 2020, you're sitting at something like 78/22 stocks to bonds. You didn't make a conscious decision to take more risk. But you're carrying way more equity exposure than your plan called for - and when March 2020 hits, the drawdown hits harder than your original 60/40 allocation was ever supposed to absorb. That's drift in action. Silent, invisible, and it bites at the worst possible moment.
| Review Cadence | Purpose | What to Look For |
|---|---|---|
| Monthly | Contribution confirmation | Automatic investments processed; no anomalies |
| Quarterly | Drift check | Any allocation drifted 5%+ from target - consider rebalancing |
| Annually | Full portfolio review | Update risk profile, increase contribution rate, reassess allocation |
| Life Events | Strategic realignment | New job, marriage, children, approaching retirement - revisit everything |
Rebalancing as Systematic Buy-Low-Sell-High
Here's what I love about mechanical rebalancing: it forces you to do the thing that everyone knows you should do but almost nobody actually does. Trim the winners. Add to the laggards. Buy low, sell high - but systematically, on a calendar, without emotion. You're not making a market call. You're not predicting anything. You're just restoring your original proportions. And somehow, that simple mechanical act produces better risk-adjusted returns over time than almost any discretionary approach. The process is the edge.
Principle 10 - Learn from Mistakes and Never Repeat Them
"This time is different." Sir John Templeton called those the four most expensive words in the English language. And yet every market cycle, an entire generation discovers them fresh - like they're the first people to ever think the old rules don't apply anymore.
The gap between successful long-term investors and everyone else isn't IQ. It isn't having better data or fancier tools. It's honesty about mistakes. After every loss, the question has to be: why, really? Was it emotional? Did I skip the research? Did I use too much leverage? Did I just follow the crowd because it felt safe? And then - and this is the hard part - you actually have to change. Most people do the post-mortem, nod sagely, and then make the exact same mistake eighteen months later in a different wrapper.
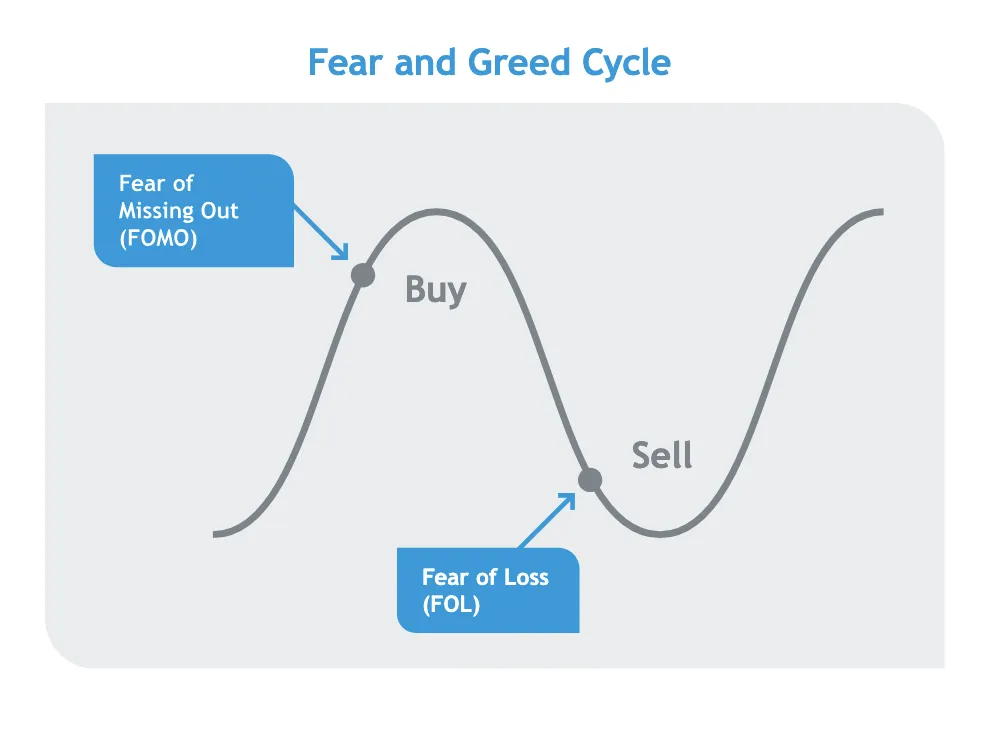
The Two Adversaries That Never Retire
Fear makes you sell at the bottom. You know this. I know this. Everyone knows this. And people still do it, every single crash, because knowing something intellectually and controlling your behavior when your portfolio is down 35% are entirely different skills. Greed makes you chase momentum and buy at the top. It whispers that this time is different, that the trend will continue, that you're leaving money on the table. The only real defense I've seen work consistently is a written Investment Policy Statement - a document you create when you're calm that explicitly states your strategy, your allocation, your rebalancing rules, and the conditions under which you will and will not deviate. It's a letter from your rational self to your future panicking self. Write it before you need it.
| Common Mistake | Root Cause | The Discipline That Prevents It |
|---|---|---|
| Panic selling in crashes | Fear of Loss (FOL) | Written IPS; pre-committed "will not sell" rule during drawdowns |
| Chasing last year's best performer | FOMO + recency bias | Mechanical rebalancing; valuation-based entry discipline |
| Concentrating in one position | Overconfidence in a single idea | Hard position size limits (no single holding above 5–10%) |
| Abandoning strategy during volatility | Short-term thinking | Anchor all decisions to decade-scale goals, not monthly performance |
| Doubling down after big losses | Revenge trading / ego | Mandatory pause and root-cause review before any new capital commitment |
The Investment Philosophy Framework
Principles without a framework are just nice ideas. They need to live inside something coherent - something that connects your goals, your decision-making process, and your expectations into a system that actually holds together when markets get ugly.
Research keeps pointing to the same three reasons investors fail: they expected too much, they had no guiding principles to fall back on when things got hard, and they were operating without a real plan. That's it. Not bad stock picks. Not bad timing. Structural failures in how they set themselves up. Fix those three things - set realistic expectations, ground your decisions in principles that have survived every market environment, and write an actual plan - and you've eliminated the majority of ways that long-term investors blow themselves up. It won't make you immune to bad years. Nothing will. But it makes you dramatically less likely to abandon a sound strategy during the inevitable rough patches.
The Enduring Formula
Start early. Invest consistently. Diversify. Keep costs low. Don't panic. Stay the course. That's it. No finance degree required. No Bloomberg terminal. No special access to investments ordinary people can't buy. The formula has worked through world wars, oil crises, financial meltdowns, pandemics, and every flavor of "this time is different" that the past century has produced. The only variable is whether the person applying it has the discipline to stick with it when the short-term noise gets loud. Most won't. And that, frankly, is why the formula works so well for those who do.
PolyMarkets Investment Strategies, Market Research, September 2025