There is a version of this story that most analysts missed - not because the data wasn't there, but because it required sitting with an uncomfortable truth: the EQT you're looking at today is not the company it was eighteen months ago. The Equitrans acquisition, closed in July 2024, was not just a midstream bolt-on. It was a structural transformation that collapsed gathering costs from $0.58 to $0.09 per Mcfe in a single quarter, dropped the company's unlevered breakeven to $2.03/Mcfe (the Q4 2024 unlevered cash operating cost - EQT's purest measure of production efficiency, excluding interest and midstream capital), and created the only vertically integrated dry-gas producer in the Appalachian basin with preferential access to its own takeaway pipe - the Mountain Valley Pipeline. A note on breakeven metrics used throughout this tip: EQT reports several distinct breakeven figures. The unlevered cash cost ($2.03/Mcfe) reflects pure operating efficiency for Q4; the unlevered maintenance breakeven ($2.08/Mcfe) is the full-year 2025 equivalent on a maintenance free cash flow basis; the all-in free cash flow breakeven ($2.28/Mcfe) incorporates interest expense and sustaining capex for the full year; and the Q4 all-in FCF breakeven ($2.43/Mcfe) is the most conservative single-quarter measure. Each figure is labelled at its point of use below.
Since that acquisition closed, EQT has rallied 37.6% - outperforming the XOP (S&P Oil & Gas E&P ETF) by over 43 percentage points. That kind of spread between a single name and its sector benchmark doesn't happen on sentiment alone. It happens when the fundamentals are moving faster than the consensus can update its models. And yet, even after that move, EQT remains roughly the 360th largest S&P 500 component by market cap. Under the radar. Below institutional allocation thresholds. Priced like a commodity producer in a world where it has quietly become something closer to a vertically integrated infrastructure-plus-production platform.
This note lays out why I think the market hasn't fully re-rated EQT's cost profile yet, and why the combination of free cash flow, rapid deleveraging, differentiated well performance, an innovative Blackstone midstream structure, and an improving gas backdrop makes this one of the cleaner asymmetric setups in energy right now. Entry $44-$47. Target $52-$68 over 9-12 months.
In the commodity business, people talk about price. But the producers who survive across full cycles - and who generate real shareholder value - are the ones obsessed with cost. It is a game of pennies. It does not take too many additional pennies saved per unit of production to begin to materially outperform the industry, and conversely, a few pennies too many can make the difference between profitability and losses in a downturn.
When EQT completed the Equitrans acquisition, it did something that doesn't happen often in commodity businesses: it fundamentally changed what it costs to produce a unit of gas, not by squeezing on the margin, but by removing an entire cost layer from the P&L. Before the deal, EQT paid Equitrans - as an external midstream operator - gathering fees of $0.58 per Mcfe. These flowed out of EQT's income statement as cash costs every quarter, regardless of where gas prices were. After the acquisition, that gathering charge effectively becomes an intra-company transfer. The cost plummeted to $0.09 per Mcfe - a reduction of 84% in a single line item. The residual $0.09/Mcfe represents third-party interconnect fees and state-regulated pipeline tariffs that persist even within the consolidated structure - costs that cannot be eliminated through vertical integration alone. The commercially controllable gathering spread has been internalised; only the regulatory floor remains.
For a company producing over 2,200 Bcfe a year, that is roughly $1.1 billion in annual savings that the market is still digesting. And unlike a one-time efficiency programme or a hedging gain that washes out next quarter, this is structural. The midstream is now inside the company. The gathering cost doesn't come back. What the Equitrans integration did was permanently lower the floor under EQT's economics - and the proof showed up immediately in the operating data.
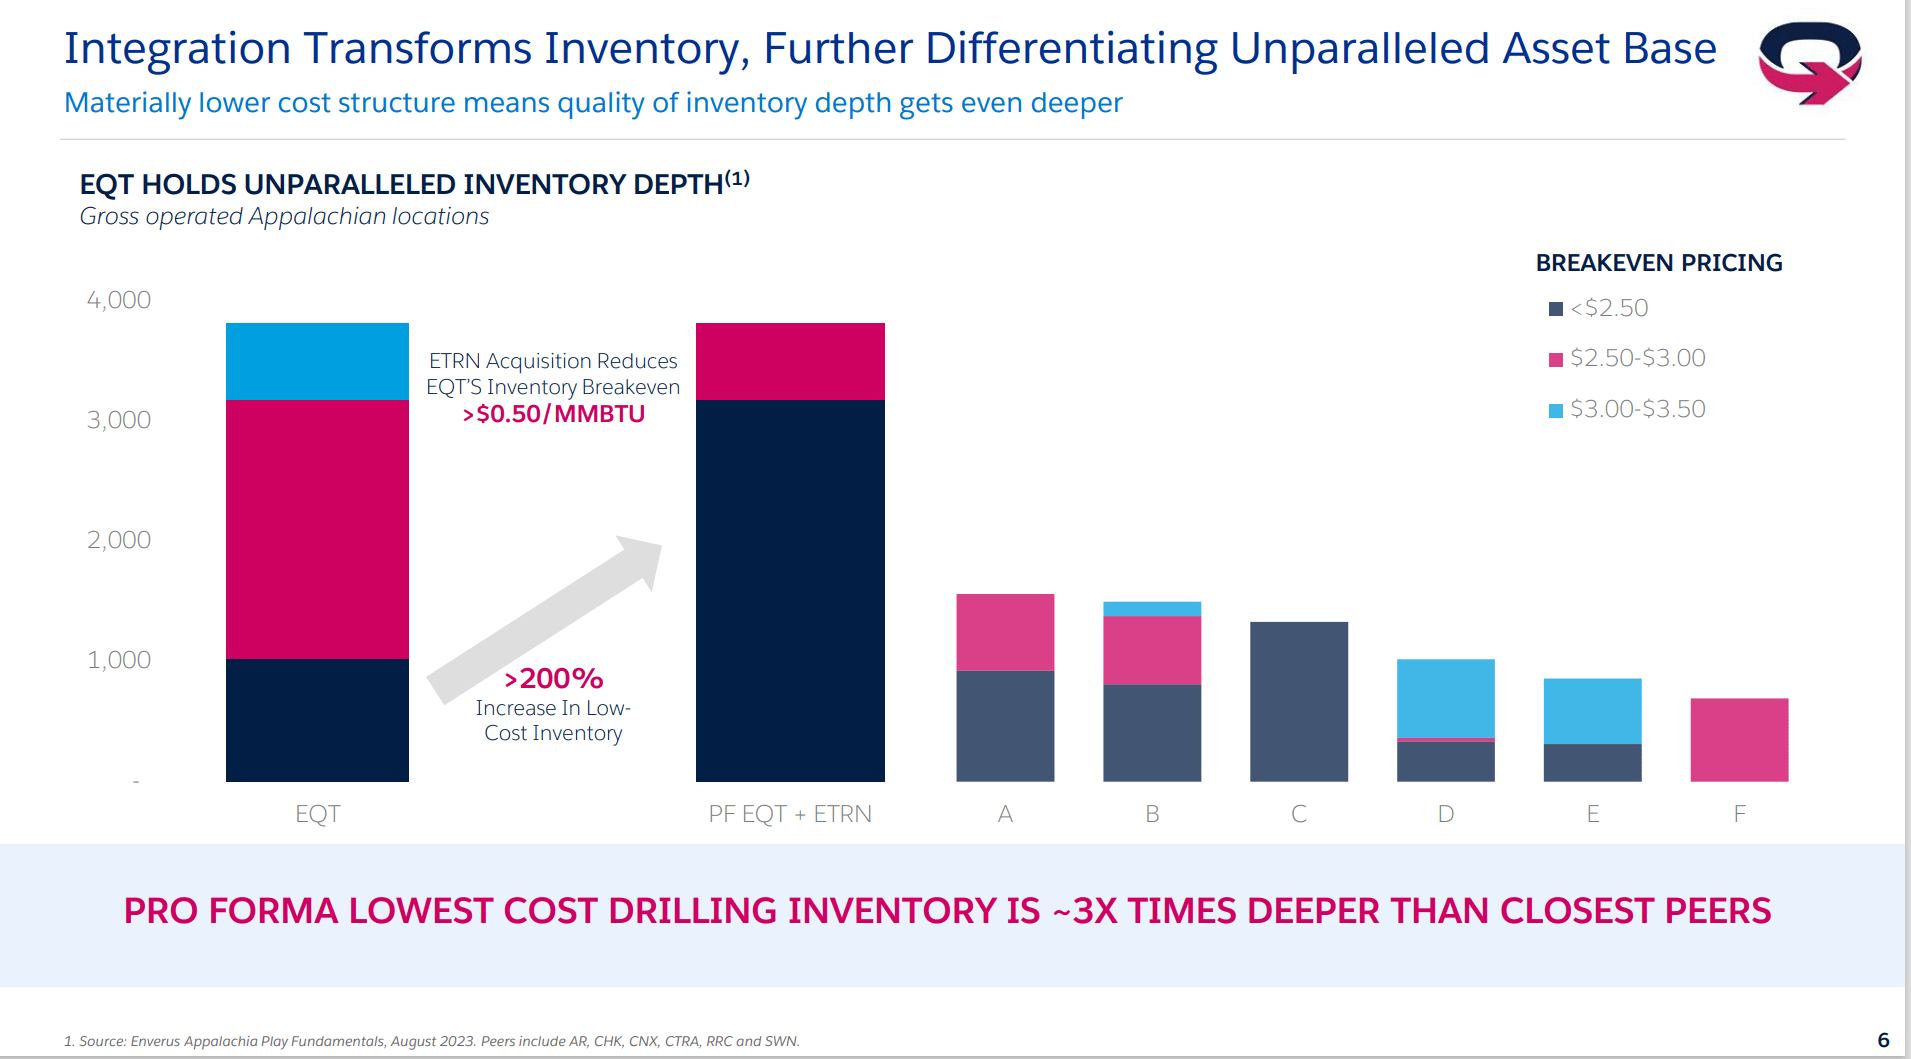
The inventory chart above makes the structural case visually. EQT + Equitrans has moved more than 3,000 locations into the sub-$2.50 breakeven tier - roughly three times the depth of its closest Appalachian peer. That is not just a current-quarter advantage. It defines EQT's cost position for the next decade of drilling. The pro forma low-cost inventory is approximately three times deeper than any competitor in the basin - Antero Resources, CNX Resources, Coterra Energy, Range Resources - none come close. And this depth of inventory at this breakeven means EQT can maintain production levels and generate free cash flow even in price environments that would force peers into curtailment.
There is a subtlety here worth emphasising. The integration didn't just lower gathering costs. It gave EQT operational control over the entire midstream network that connects its wells to market. That means the upstream and midstream operations can be coordinated to maximise joint profitability - something that was never possible when the gathering system was run by a separate public company with its own shareholders and incentives. As one analyst observed, the midstream may turn out to be "unusually profitable" precisely because of this close coordination - an outcome that independent midstream operators, by structural design, cannot replicate.
One thing I look for in an operator is whether results tell the same story as management's tone. In EQT's case, Q4 2024 was consistent in both: the company beat guidance across essentially every line item, and the nature of the beat was operationally genuine rather than accounting-driven. This is a management team - the Rice Brothers, who won the proxy fight and took control - that has developed a pattern of under-promising and over-delivering. It's not a coincidence. It's a strategy.
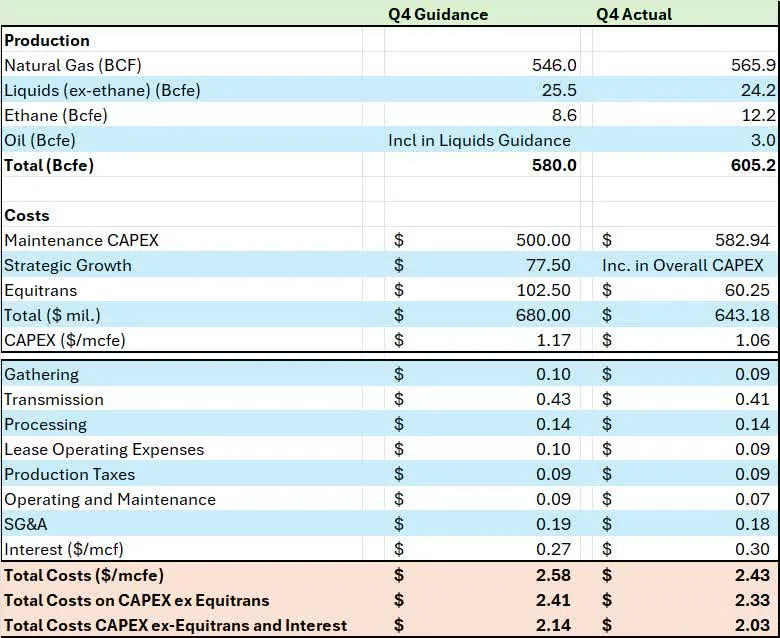
Production came in at 605.2 Bcfe against a guidance midpoint of 580 - above even the top of the guidance range. Natural gas alone was 565.9 BCF versus 546 BCF guided. Management attributed the entire beat to operational efficiency and strong well performance, not pulled-forward well timing. Capital intensity dropped to $1.06/Mcfe versus the $1.17 guidance midpoint. The result: an all-in free cash flow breakeven of $2.43/Mcfe (Q4 all-in FCF breakeven - the most conservative measure, including interest and sustaining capex), meaningfully better than the $2.58 flagged just three months prior. The unlevered breakeven excluding Equitrans came in at $2.03/Mcfe (Q4 unlevered cash operating cost) versus $2.14 guided - one of the lowest breakeven cost structures of any natural gas E&P operating in the United States today.
What is often overlooked in the headline numbers is the per-unit cost table. Below is the actual granularity:
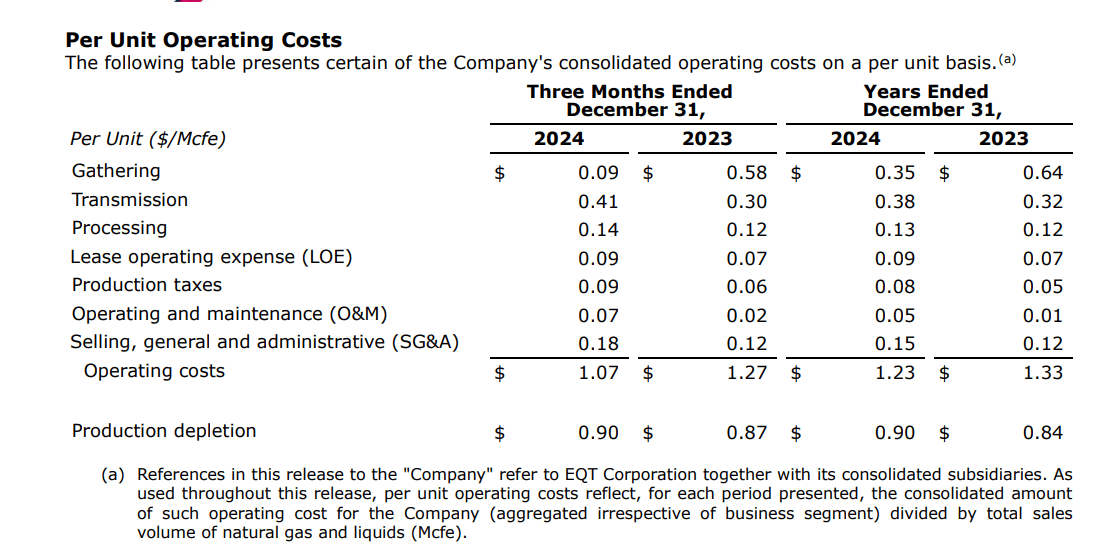
Walk through the line items and the story becomes clear. Gathering: $0.58 down to $0.09 - the Equitrans effect. Processing: $0.12 to $0.14 - essentially flat. LOE: $0.07 to $0.09 - marginal increase. Production taxes: $0.06 to $0.09 - higher because realised prices were higher (a good problem). SG&A: $0.12 to $0.18 - the only meaningful increase, reflecting the larger combined entity's overhead. The one number bears point to is transmission, which rose from $0.30 to $0.41/Mcfe - a direct consequence of the Mountain Valley Pipeline ramp. That increase is real, but it is also the cost of accessing premium pricing at the Gulf Coast rather than selling at depressed in-basin rates. It's a cost that pays for itself through better realisations.
The cash flow statement tells the operational story even more directly. Q4 free cash flow came in at $580 million - up from $229 million in Q4 2023. Full-year adjusted operating cash flow was $3.1 billion versus $2.8 billion the prior year, despite 2024 including hundreds of millions in one-time merger transaction costs. Strip out those merger costs and the underlying cash generation machine is running well above what the stock price implies.
The average realised price in Q4 2024 was $3.01/MCF - well above the depressed levels of the prior year. With EQT's Q4 all-in FCF breakeven at $2.43/Mcfe (the most conservative measure, including interest and sustaining capex), every incremental dollar of gas price above breakeven flows almost entirely to free cash flow. That is the definition of operating leverage.
The Equitrans cost savings are the headline. But underneath that headline sits an operational improvement story that the market has almost entirely ignored. EQT's wells are getting materially better - and they are getting better faster than the rest of the basin.
In 2021, EQT's cumulative gas production per 1,000 lateral feet was at or slightly below the Appalachian peer average. That includes Antero Resources, CNX, Coterra, Range Resources, and the legacy Southwestern Energy assets. By 2024, EQT has pulled significantly above all of them. The company's well results are "differentially improving" relative to peers - their words, but the data backs it up. This well outperformance drove 65 Bcfe of production upside in 2024 alone - production that was not in the original plan and came from better rock understanding and execution, not additional capital spending.
The efficiency gains extend to the completion side. EQT achieved an all-time high in completion efficiency in 2024, with completed lateral footage per day increasing approximately 20% through the first three quarters and accelerating to 35% above 2023 levels by Q4. The company reduced its frac crew count from three to two - yet produced more gas. More output with fewer crews means lower cost per foot of completed well, and the company's well cost per foot dropped to approximately $1,000 in 2024, with guidance for a further 5-10% decline in 2025 - taking it toward the $950 range.
"Growth stories like this are not that common in the commodity business. EQT is producing more gas with fewer people and less equipment, and doing it at costs that are structurally below every Appalachian peer. The efficiency gains come in lumps - a big year of improvement, then consolidation, then another big year - and 2024 was unmistakably a big year."
- Oil & Gas Value Research, February 2025There is a compounding effect at work here that commodity-sector generalists tend to miss. When you lower your cost per foot of completed well and simultaneously improve your production per foot of lateral, the return on each dollar of capital deployed rises non-linearly. EQT's capital efficiency - measured as production per dollar of development spending - is diverging from the pack. And because the company controls its own gathering network, there is no external midstream operator capturing a share of that improvement. The full benefit flows to EQT shareholders.
Consider the full-year 2025 guidance through this lens. Total production guidance is 2,225 Bcfe at a total capital programme of $2.4 billion, implying a maintenance CAPEX rate of $0.91/Mcfe. That is a step-change from historical levels and reflects the operational improvements compounding: better wells, faster completions, lower per-foot costs, and zero external gathering leakage. The result is a maintenance breakeven of just $2.28/Mcfe (full-year 2025 all-in FCF breakeven, including interest and sustaining capex) and an unlevered maintenance breakeven of $2.08/Mcfe (full-year 2025 maintenance-level FCF breakeven, excluding interest) - both among the lowest in the North American upstream business.
The Equitrans acquisition created a problem alongside its solution. It gave EQT the industry's lowest cost structure, but it also loaded the balance sheet with $13.7 billion in net debt as of September 30, 2024. That is an uncomfortable number for any E&P, and it's the single biggest reason the market has been slow to re-rate the stock. Management understood this, and their response has been one of the more creative pieces of financial engineering I've seen in the upstream sector.
The centrepiece is the Blackstone Credit & Insurance (BXCI) midstream joint venture. Rather than selling the Equitrans assets outright - which would have defeated the purpose of the acquisition - EQT structured a JV that monetises a portion of the midstream cash flows upfront while retaining operational control and long-term ownership optionality. The deal generated $3.5 billion in immediate proceeds. Combined with the $1.75 billion non-operated well package sale, total asset monetisation reached $5.25 billion - exceeding the company's own $3-5 billion target range.
The Blackstone JV structure deserves closer examination because it reveals how thoughtfully EQT approached the deleveraging problem. Cash distributions from the midstream JV are split 40% to EQT and 60% to BXCI in the early years, with Blackstone's return capped at 7.875%. Once that target return is achieved, the split flips to 95% EQT / 5% BXCI. And critically, EQT retains a buyout option between the 8th and 12th anniversary of the deal. The illustrative buyout multiples decline over time: 4.0x EBITDA in 2033, dropping to 3.3x in 2034, 2.5x in 2035, 1.7x in 2036, and just 0.9x by 2037. In plain terms, if EQT is patient, it gets the midstream back for almost nothing. Meanwhile, it operates the JV and controls all key decision-making throughout.
The net debt waterfall tells the story. From $13.7 billion at September 30, 2024, the combination of asset sales brought net debt to $9.1 billion at year-end. The original year-end 2025 target was $7.5 billion; management has since tightened that to $7.0 billion. At $4.00/MMBtu gas, they reach it comfortably. Even at $2.50 gas, net debt would be approximately $8.5 billion - still a meaningful reduction that keeps the trajectory intact. The long-term target remains $5.0 billion, at which point the balance sheet would be among the cleanest in the E&P sector.
The credit markets have already begun to recognise this. EQT's credit spreads have compressed to their tightest levels, trading in-line with the broader BBB index. The company holds investment-grade ratings from all three agencies - S&P BBB- Stable, Fitch BBB- Stable, and Moody's Baa3 (though Moody's outlook is Negative, reflecting the leverage overhang that the deleveraging programme is designed to resolve). Interest expense in 2025 guidance sits at $0.20/Mcfe - management's own estimate implies roughly a one-third reduction from Q4 2024's $0.30/Mcfe level as debt retirement flows through. Every billion of debt paid down doesn't just reduce risk; it directly expands the equity value available to shareholders.
The key insight: EQT traded short-term midstream cash flows (40/60 split with Blackstone) for immediate balance sheet repair, while retaining operational control and a declining-cost buyout option. It's the financial equivalent of renting out a room to pay down the mortgage faster, knowing you get the room back for free in a few years. A better management team for navigating complex deal structures would be hard to find.
EQT's cost transformation was necessary but not sufficient on its own. The stock needs a commodity environment that gives the market a reason to look. As of late February 2025, that environment is beginning to emerge - and it is coming from more directions than most analysts have mapped. Natural gas has been down 85% from its peak, in terms of the commodity benchmark. Things that fall that far either die or come back with force. This is the commodity that powers the American grid, heats American homes, and is about to underpin an entirely new structural demand vector in AI-driven power consumption. The setup is not just cyclical. It is structural.
Most commodity analysts stop at the headline hedge ratio. But the structure of the hedges matters as much as the volume. EQT's 2025 hedge book reveals a management team that is protecting the downside while deliberately leaving the upside open - and it gets more open as the year progresses.
In Q1 2025, approximately 60% of production is hedged: 250 Bcf in swaps at $3.49/MMBtu and 82 Bcf in long put options at $3.29. The puts provide a floor without capping the upside. The short call options on 188 Bcf are struck at $4.19 - high enough that EQT captures the majority of any price move into the $4+ range. Q2 is structured similarly, with swaps at $3.11 and short calls at $3.48.
The picture shifts dramatically in the second half. Q3 has 281 Bcf in swaps at $3.26, but no put or call positions at all - pure fixed-price protection with no upside cap. And Q4 is where it gets interesting: only 95 Bcf in swaps at $3.27, with 186 Bcf in long puts at $3.30 (floor protection) and short calls at $5.49 - an extraordinarily high strike. At $5.49, EQT would need to see gas prices 35% above the current strip before any upside cap binds. That is a management team positioning for the possibility of a genuine gas price breakout.
And then there is Q1 2026: no hedges at all. Zero. EQT is completely unhedged for the highest-priced quarter on the current futures curve, where the calendar strip sits at $4.66/MMBtu. If gas prices continue to rise - driven by storage tightness, LNG demand, or a cold winter 2025-26 - Q1 2026 will be pure operating leverage, with every dollar above breakeven flowing directly to free cash flow. The natural gas futures curve is in contango - upward sloping from $4.12 in Q2 2025 to $4.66 by Q1 2026 - and EQT's hedge book is shaped to ride that curve with maximum exposure at the top end.
"Look at the hedge book like a roadmap of management's conviction. They've locked in the floor through puts and moderate swaps in the first half, and opened up the second half and 2026 entirely. The short call strike in Q4 at $5.49 is effectively saying: we think gas could surprise to the upside, and we don't want to cap our earnings at a $4 handle when the commodity might run."
- PolyMarkets Investment Research, Feb 27, 2025The fundamental case is the primary driver here, but the technical picture deserves attention - not least because EQT was the 12th best-performing S&P 500 stock through the first 15 trading days of 2025. That kind of early-year momentum in a $32 billion name that most of the market doesn't follow closely is itself a signal worth investigating.
The broader context matters. Natural gas, as measured by the UNG ETF benchmark, is down roughly 85% from its 2022 peak. Utility stocks, which are the downstream beneficiaries of gas-fired generation, have already rallied 40% from their lows as the market priced in AI data centre power demand. But the upstream gas producers - the companies that actually supply the fuel - have barely participated. There is a pattern here that one veteran technical analyst described as a "slow, gradual shift from the favoured to the deeply out of favour" - a broadening of market participation away from the handful of mega-cap tech names toward neglected sectors. Natural gas producers are arguably the most neglected corner of the energy sector.
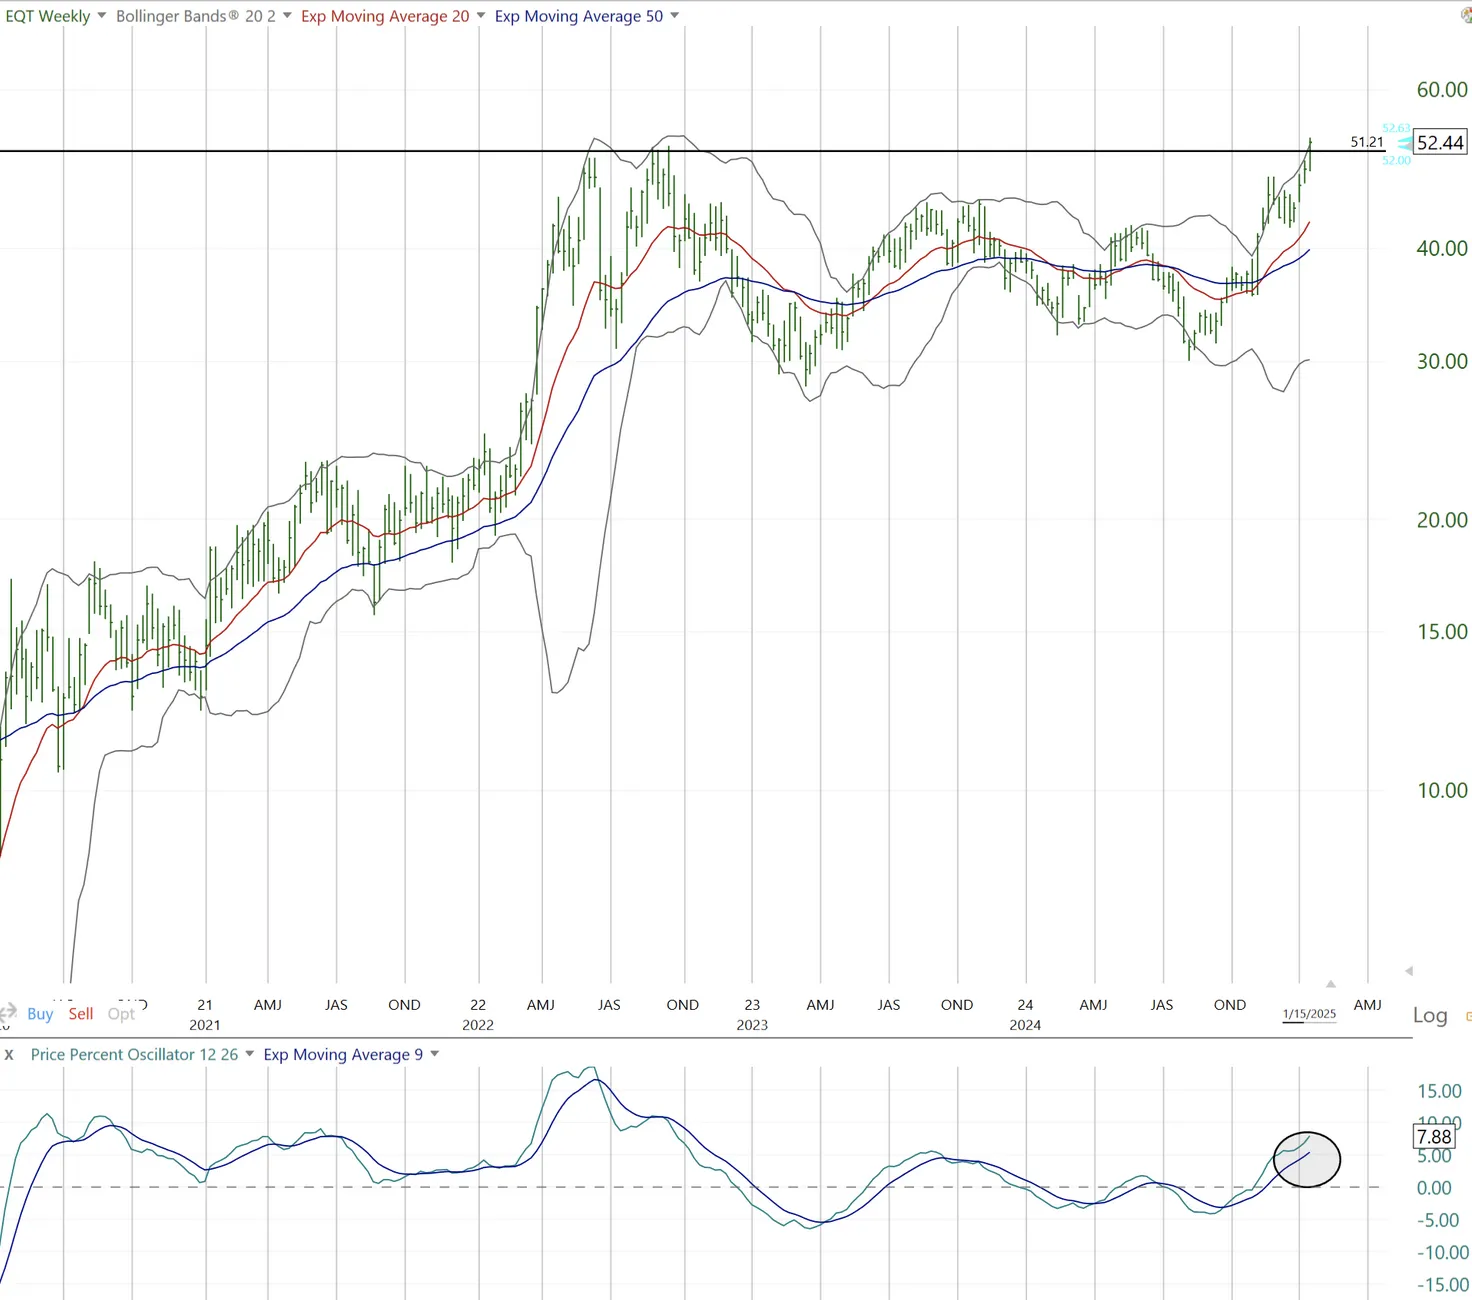
On the weekly chart, the most interesting signal is the PPO (Price Percent Oscillator) momentum indicator. After spending months in negative territory, it is curling up from an oversold extreme and forming what technicians call a "dolphin's mouth" pattern - the indicator line angling higher after a period of indecisiveness, with the signal line about to cross. Historically, this pattern on the weekly timeframe in energy names has been associated with the early stages of sustained multi-month moves, not false breakouts. The 50-week moving average has begun to slope upward, and price is consolidating just below the $52-$53 level that would represent a confirmed breakout from the 2024 trading range. EQT's stock touched an all-time high near $61 in 2014 and is now testing those structural resistance levels again after a decade of underperformance.
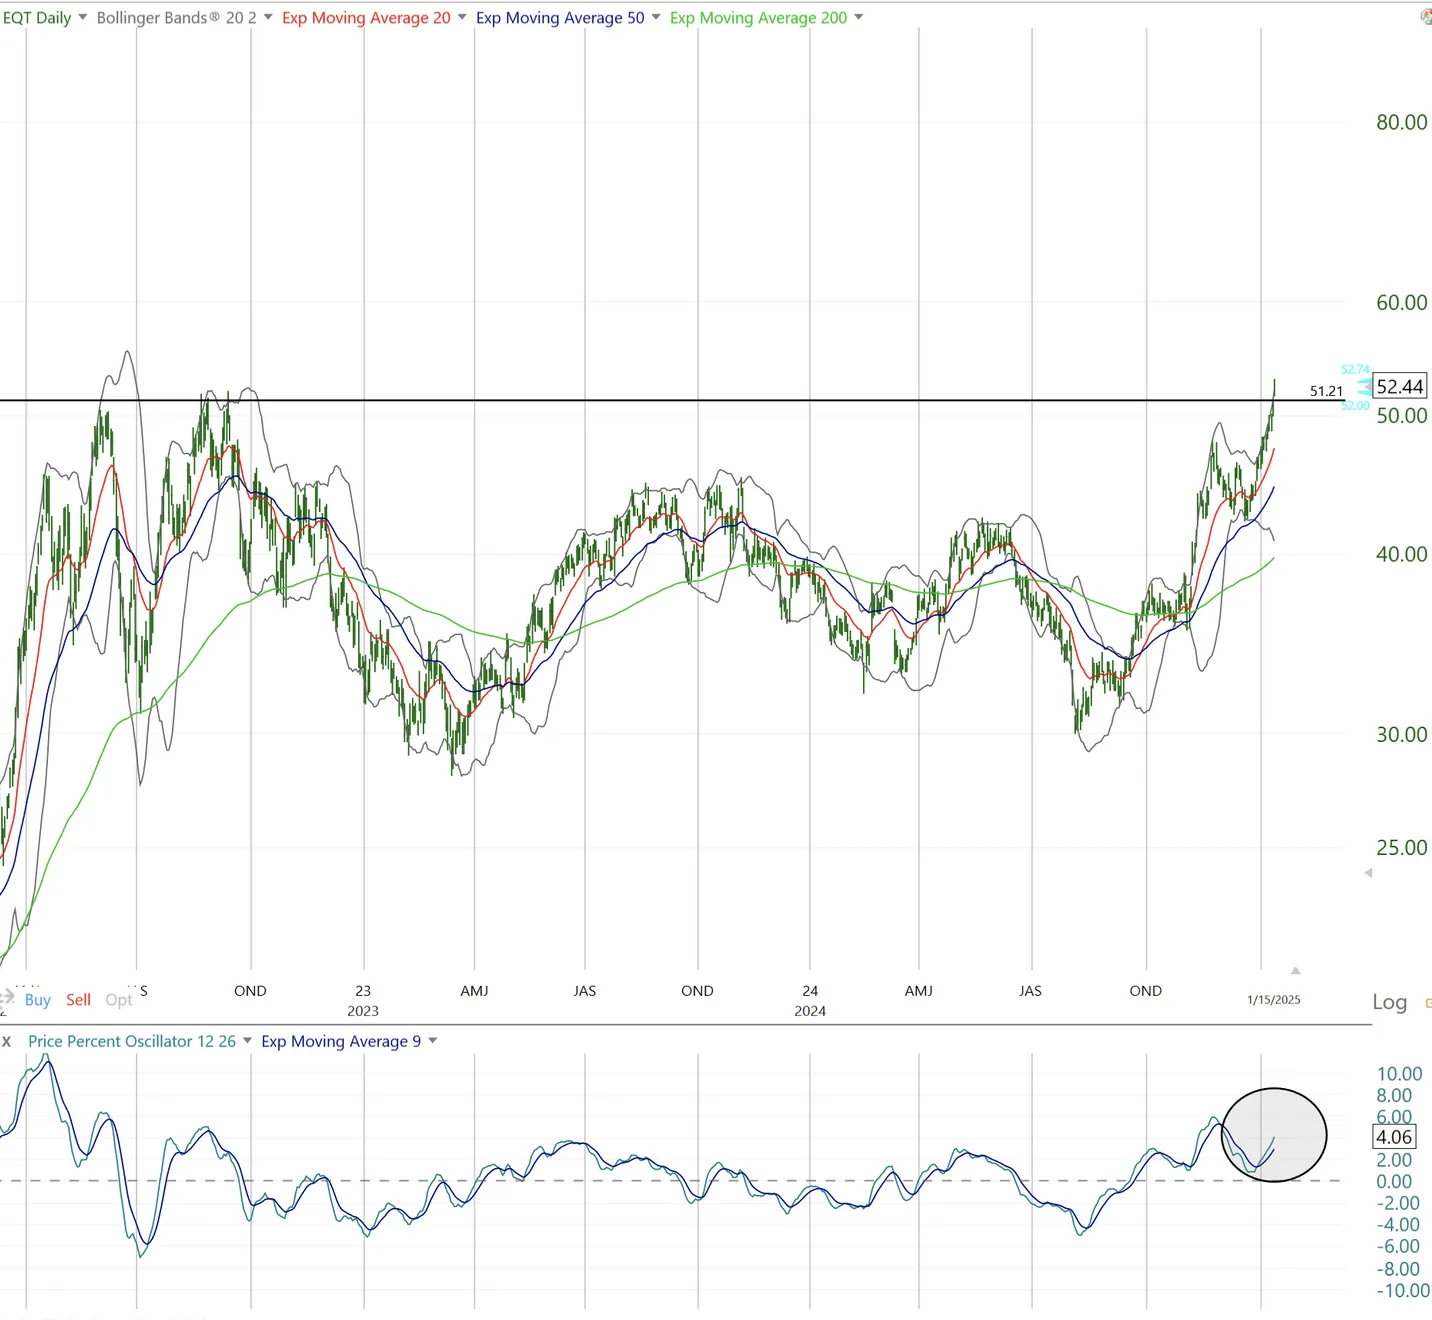
On the daily, the $44-$47 range is where entries offer the best risk/reward. It represents the confluence of the 20-day moving average, a prior consolidation base, and the midline of the daily Bollinger Bands. The key invalidation signal on the technical side: if the stock pops to $54-55 and immediately retreats below the current consolidation area, the momentum thesis would need to be reassessed. But as long as the weekly PPO structure holds - higher lows, upward angle - pullbacks to $44-47 represent re-entry opportunities, not reversals.
EQT's investment case is inherently a function of where natural gas prices settle. The beauty of the current setup is that even the bear case - flat to modestly lower gas - still produces meaningful free cash flow given the structural cost reductions. Below are three scenarios using the company's guided 2025 production midpoint of 2,225 Bcfe and an all-in cost of $2.45/Mcfe (the 2025 full-year guidance, slightly above Q4's $2.43 due to seasonal adjustments).
The math is straightforward. Take the realised price per Mcfe, subtract the all-in cost of $2.45, multiply by production of 2,225 Bcfe, and you get annualised free cash flow. At $4.00/Mcfe, that's ($4.00 - $2.45) x 2,225 = approximately $3.45 billion. EQT's own guidance is more conservative at $2.6 billion for 2025 (reflecting hedging impacts) and $3.3 billion for 2026 (with less hedging drag and potential volume growth). In an upside scenario where production reaches the 2,400 Bcfe annualised Q4 run-rate, costs come in at $2.40, and gas averages $4.25 - you are looking at approximately $4.5 billion in annualised free cash flow.
The asymmetry here is notable. The downside scenario still produces a positive re-rating from current levels, because even at $2.75 gas, EQT generates meaningful free cash flow on a cost structure that didn't exist twelve months ago. The upside scenario - which I consider more probable than consensus given the cold-winter storage draw, LNG export ramp, and data centre demand - puts EQT at the top of analyst targets. The natural gas futures curve, with Q3 2025 strip above $4.30 and Q1 2026 at $4.66, already reflects the base-to-bull gas pricing outlined above. And critically, EQT's hedge book is shaped to let that futures curve flow through to earnings rather than capping it.
One additional nuance: at $4.00+ gas, traditional quant screens - which currently show EQT with weak valuation and mediocre growth grades - would reverse dramatically. EQT would screen as a high-growth, cash-generative compounder. At that point, the stock stops being a commodity play and starts attracting generalist capital. That is the inflection the market hasn't priced.
This is not a risk-free setup. EQT carries real commodity exposure, real debt, and real execution risk. I try to size positions accordingly. The honest assessment of what could go wrong is as important as the bull case.
The following scenarios reflect the author's personal analysis and are not investment recommendations. See our full disclaimer.
The best equity setups I've found tend to share one characteristic: the market is still pricing in the old company while the new one is already performing. EQT in February 2025 fits that description precisely. The gathering cost collapse, the Equitrans integration execution, the Q4 beat across every line item, the $2.6B FCF guidance, the accelerating debt paydown, the well productivity that is pulling away from every Appalachian peer - these are not forward promises. They are reported facts that the market has not fully re-rated yet.
What makes me particularly confident in the convergence here is that four independent analytical frameworks - each approaching EQT from a different angle - arrive at the same conclusion. The deep fundamental/DCF analysis raises the target to $70 based on an 8% FCF yield applied to $4B+ annualised cash flow. The operational cost researcher focuses on the gathering cost transformation and concludes the outlook "could hardly be better." The contrarian technician identifies EQT as one of the best-positioned stocks for a broadening market rotation away from mega-cap concentration and toward neglected value sectors. And the pre-earnings structural analysis highlights the Blackstone JV as a creative deleveraging mechanism that the market hasn't given adequate credit for.
When independent methodologies converge - fundamentals, operations, technicals, and financial structure - that convergence carries weight. It is not one analyst's opinion. It is a pattern recognition across different lenses that all point in the same direction.
The natural gas backdrop adds the cyclical kicker. A stock with structural cost improvement and a commodity tailwind is a rare combination in energy. Commodity prices rise over time, but they usually rise slower than inflation - so the company that can lower its real cost of production faster than commodity price growth is the one that compounds returns across cycles. EQT, with its operational efficiency gains, its vertically integrated cost structure, and its 25+ years of sub-$2.50 breakeven inventory, is built for that kind of compounding.
The risk is real - commodity businesses always carry it, and $9.1 billion of net debt demands respect. But the asymmetry between what EQT is generating and what the current stock price implies is wide enough to be analytically compelling. The futures curve is in contango. The hedge book is shaped for upside. The operational efficiency is accelerating. The balance sheet is de-risking quarter by quarter. The analyst community is beginning to catch up, with a $70 target from the high-end, multiple buy ratings post-earnings, and growing institutional attention to what was recently the 360th largest name in the index.
The question, as always, is not whether the re-rating will happen. It is whether you are positioned before or after it completes.
Disclaimer: This market tip represents the author's personal research and analytical opinion as of February 27, 2025. It does not constitute financial advice or a recommendation to buy or sell securities. Natural gas prices are inherently volatile and EQT carries material debt obligations. Readers should conduct their own due diligence and consult qualified financial advisors before making investment decisions. Position sizing should reflect individual risk tolerance.